
How To Add Moving Averages in Tradingview 2025
Introduction
Moving averages are one of the most popular and versatile indicators in technical analysis. They help smooth out price data to identify trends, making them essential for traders and investors across stocks, forex, and cryptocurrencies. In this guide, you'll learn how to add, customize, and analyze both Simple Moving Averages (SMA) and Exponential Moving Averages (EMA) on TradingView. Whether you're a beginner or looking to fine-tune your strategy, these step-by-step instructions and expert insights will help you harness the full power of moving averages.
Unlock Exclusive Trading Benefits!
✔ TradingView - $15 Bonus & 30-Day Free Premium
Claim Your Bonus NowHow to Add Moving Averages in TradingView
Step 1: Open TradingView
Firstly, navigate to TradingView's Website. Ensure you're logged in to your account to access all the features and save your settings.
Step 2: Select Your Chart
To open a chart in TradingView, you want to press on products and then on supercharts. Choose the chart to which you want to add the moving average. You can select any financial instrument, be it forex, stocks, or cryptocurrencies.

Step 3: Add the Moving Average
To add a moving average, click on the 'Indicators' icon at the top of your chart. It's the symbol that looks like the image below. In the search box, type "Moving Average." You'll see a list of different moving average types.
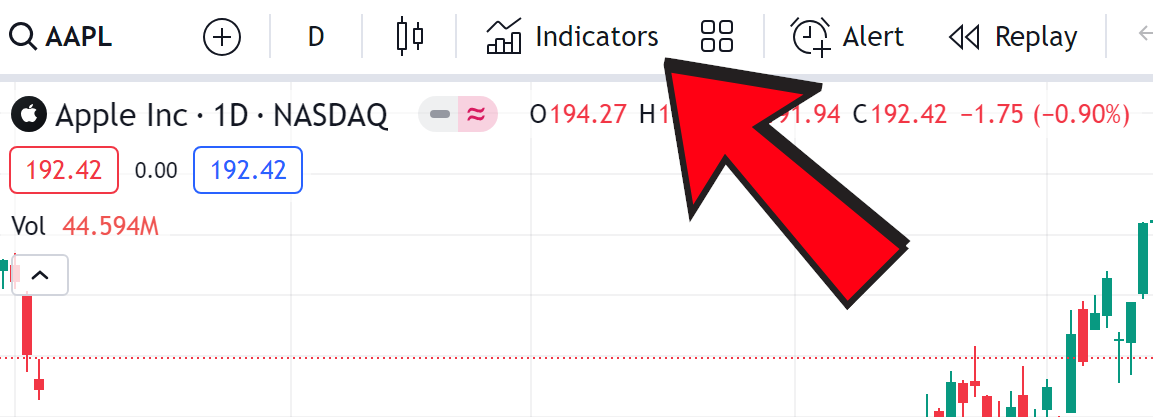
TradingView Indicators Tab
Step 4: Choose Your Moving Average Type
You can select either SMA (Simple Moving Average) or EMA (Exponential Moving Average). For beginners, the SMA is a good start as it gives equal weight to all prices in the series. For more responsive moving averages, choose EMA.
Step 5: Customize Your Moving Average
After adding it to your chart, customize it by clicking on the settings icon next to the moving average name on your chart. Here, you can change the period, which affects how the moving average is calculated. You can also adjust the color and thickness for better visibility.
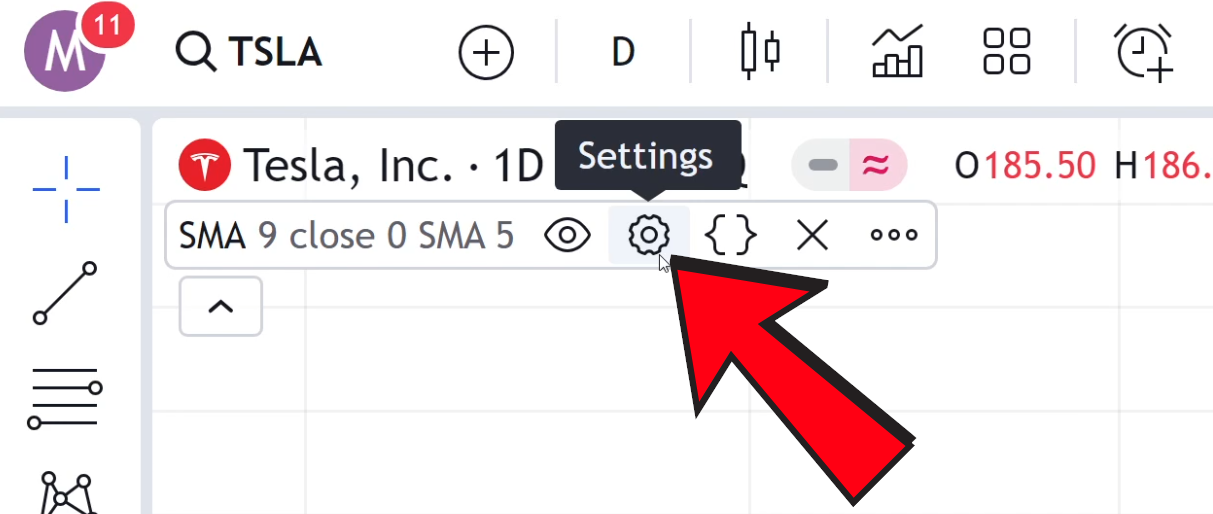
Moving Average Settings
Step 6: Analyze the Moving Average
Once added, use the moving average to analyze the market trend. Remember, the moving average smooths out price data, creating a single flowing line that makes it easier to identify the direction of the trend.
Step 7: Apply Moving Average Trading Strategies
You can use moving averages for various trading strategies. For instance, some traders look for the crossover of two moving averages as a trading signal. However, this is often not a good strategy. In future articles, I will talk about why! :)
Pro Tips for Using Moving Averages on TradingView
Combine with Other Indicators: Enhance your trading signals by using moving averages alongside indicators like RSI or MACD. This multi-indicator approach can help filter out false signals.
Experiment with Different Periods: There isn’t a one-size-fits-all moving average. Try different periods (e.g., 20, 50, or 200 days) to see which works best with your trading style and the current market conditions.
Customize for Clarity: Adjust the color and thickness of your moving averages so they stand out on your chart. This customization is especially helpful when using multiple averages simultaneously.
Understand Crossover Signals: While a crossover of two moving averages can indicate a potential trend change, be cautious of market volatility. Always consider the broader market context before acting on these signals.
Moving Average Frequently Asked Questions (FAQ)
Moving Average FAQ
Additional Resources
Additional Resources
Understanding the Simple Moving Average (SMA)
Learn the fundamentals of SMA and how this key indicator can enhance your technical analysis.
The Arnaud Legoux Moving Average (ALMA)
Explore the ALMA technique and its benefits for a smoother, more responsive moving average in your trading.
Understanding the MACD Indicator
Delve into the MACD indicator’s components and learn how its built-in moving averages can help confirm market trends.
Break of Structure (BOS) & Change of Character (CHOCH)
Discover how market structure shifts can signal trading opportunities and complement your moving averages analysis.
Conclusion
Adding moving averages on TradingView is a straightforward process that can significantly enhance your trading analysis. Whether you prefer the SMA for its simplicity or the EMA for its quicker response to price changes, both can be powerful tools in your trading arsenal. Always remember, the best moving average depends on your trading style and the specific market conditions.