
How to Add Moving Averages in TradingView
Learn how to integrate moving averages with RSI for trend confirmation and better entry points.
Updated March 4, 2025
The RSI indicator measures momentum and helps identify overbought (above 70) and oversold (below 30) conditions.
RSI divergence, where price and RSI move oppositely, can signal potential trend reversals.
Combine RSI with other tools like moving averages and price action for better trading accuracy.
Today, we're breaking down one of the most powerful and widely-used trading tools: the RSI Indicator (Relative Strength Index). Specifically, you'll discover practical strategies for using RSI effectively in TradingView. Whether you're an experienced trader or just beginning your trading journey, mastering RSI can help you spot profitable opportunities, better manage risk, and significantly elevate your trading results.
Prefer watching to reading? 📺 Here's a quick, beginner-friendly YouTube guide (just 2 minutes!) showing exactly how to set up and use the RSI indicator in TradingView.
To start using the RSI indicator in TradingView, first, navigate to the ‘Indicators’ tab at the top of the page. Here, you can simply search for 'RSI' or 'Relative Strength Index'. Select the first indicator named 'Relative Strength Index', and it will appear at the bottom of your chart.

TradingView Indicators Tab
The RSI is a momentum indicator, measuring the speed and change of price movements. It moves between zero and 100. Generally, when the RSI is above 70, it may indicate that an asset is overbought, while an RSI below 30 might suggest an oversold condition.
In the trading world, 'overbought' refers to a situation where prices have risen more than the market average. Conversely, 'oversold' means prices have fallen more than usual. These conditions can signal potential reversal points; however, it's crucial to note that continuation of the current trend is also possible. For instance, an overbought RSI can remain high during a strong uptrend. That’s where the power of RSI Divergence comes in.
One effective way to utilize the RSI is by identifying divergences. A divergence occurs when the price action of an asset moves in the opposite direction of the RSI. For example, if the price makes higher highs while the RSI makes lower highs, this is known as a bearish divergence, often indicating a potential reversal to the downside.
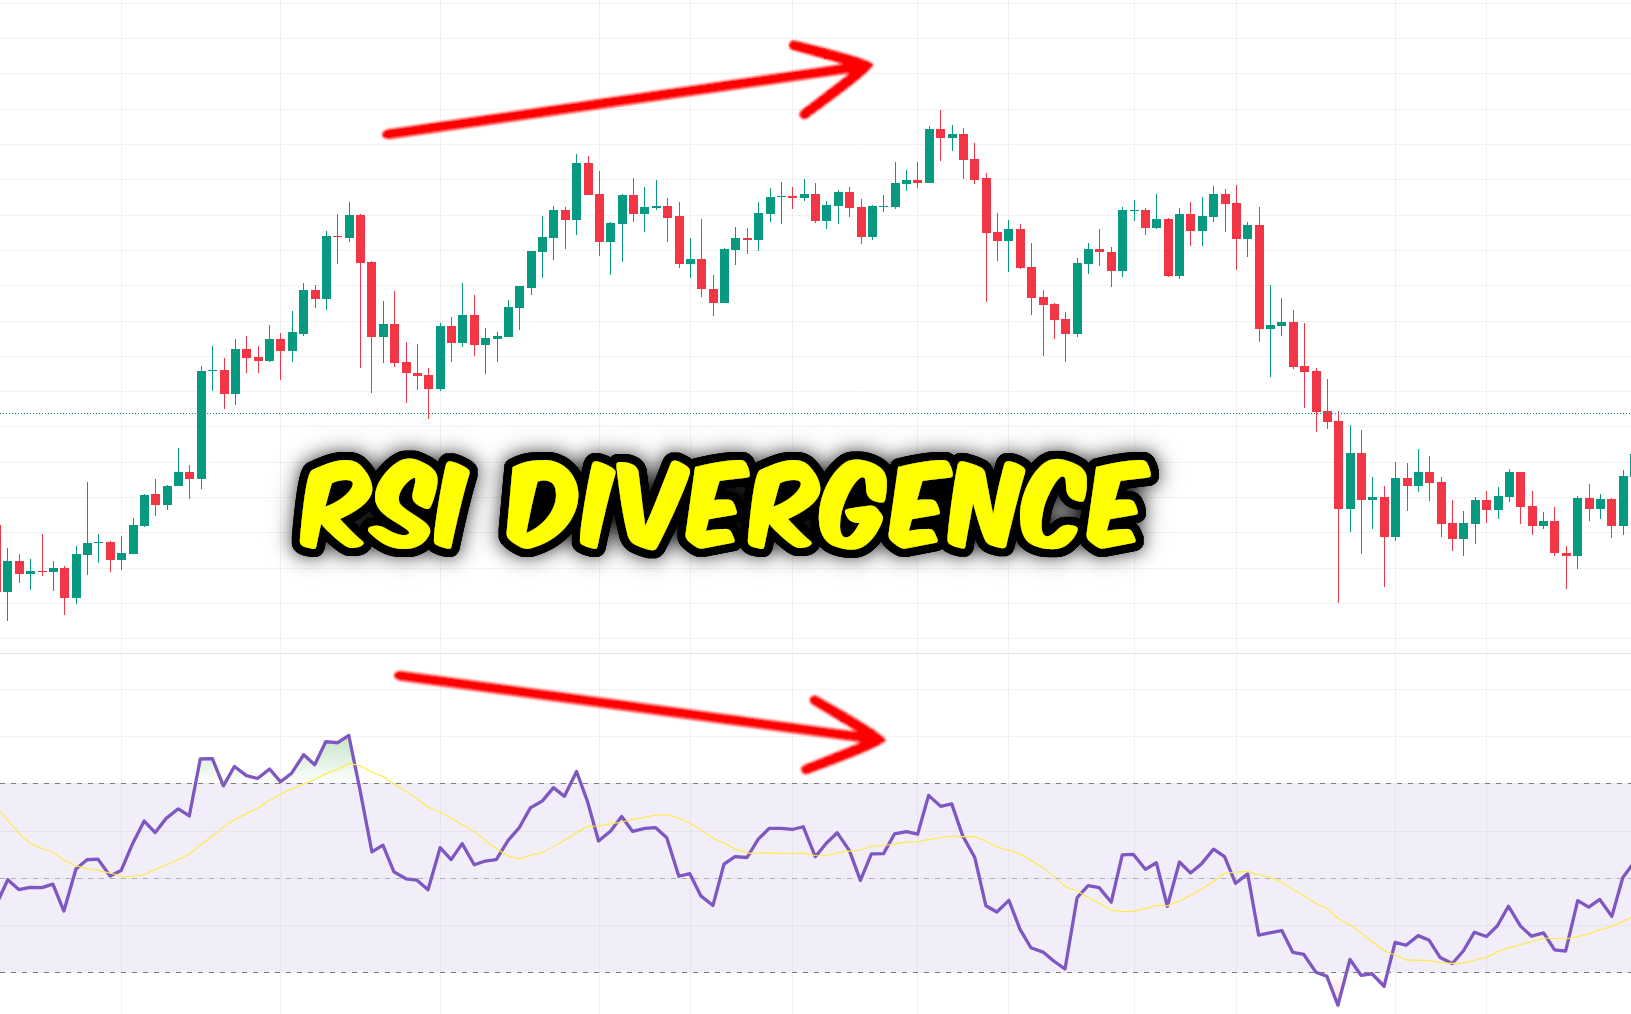
RSI Divergence
The RSI (Relative Strength Index) is a momentum indicator that measures the speed and change of price movements. It oscillates between 0 and 100 and is used to identify overbought or oversold conditions in a market.
Generally, an RSI above 70 indicates that an asset may be overbought, while an RSI below 30 suggests it may be oversold. However, these levels can vary depending on the market and asset.
RSI divergence occurs when the price moves in the opposite direction of the RSI. For example, a bearish divergence happens when price makes higher highs but RSI makes lower highs, signaling a potential reversal.
No, RSI should not be used in isolation. Combine it with other indicators, price action, and market structure for more reliable trading decisions.
In TradingView, click the ‘Indicators’ tab, search for ‘RSI’ or ‘Relative Strength Index’, and select it to add it to your chart.
The RSI indicator is a powerful tool in your TradingView arsenal. By understanding its basic concept, and especially by paying attention to divergences, you can enhance your trading analysis significantly. Remember, no indicator should be used in isolation, but rather as part of a comprehensive trading strategy. It’s a good rule of thumb to always combine indicators with price action and market structure to improve the win rate.
For a more in-depth analysis, consider combining the RSI with another powerful TradingView tool – the moving average. To learn more about effectively using the moving average in conjunction with the RSI, check out our detailed guide here.
Learn how to integrate moving averages with RSI for trend confirmation and better entry points.
Explore how MACD complements RSI to spot momentum shifts and trend changes.
Master RSI divergence for forecasting reversals in forex, crypto, and stocks.
Enhance your RSI analysis with TradingView’s auto chart patterns tool.
(Limited Time: Save 70% Today!)
Unlock cutting-edge trading strategies with InvestingPro.
Access advanced charting tools and premium features.
Join Bybit for high-leverage crypto trading opportunities.
I bought my first stock at 16, and since then, financial markets have fascinated me. Understanding how human behavior shapes market structure and price action is both intellectually and financially rewarding.
I’ve always loved teaching—helping people have their “aha moments” is an amazing feeling. That’s why I created Mind Math Money to share insights on trading, technical analysis, and finance.
Over the years, I’ve built a community of over 200,000 YouTube followers, all striving to become better traders. Check out my YouTube channel for more insights and tutorials.