Bull Flag Pattern: The Best Day Trading Strategy for Beginners (2026 Guide)
Learn the bull flag pattern—one of the most reliable day trading strategies for beginners. Discover the 3 confirmations that must align before entering, how to draw the pattern on TradingView, and where to place your entry and stop loss for optimal risk-reward.

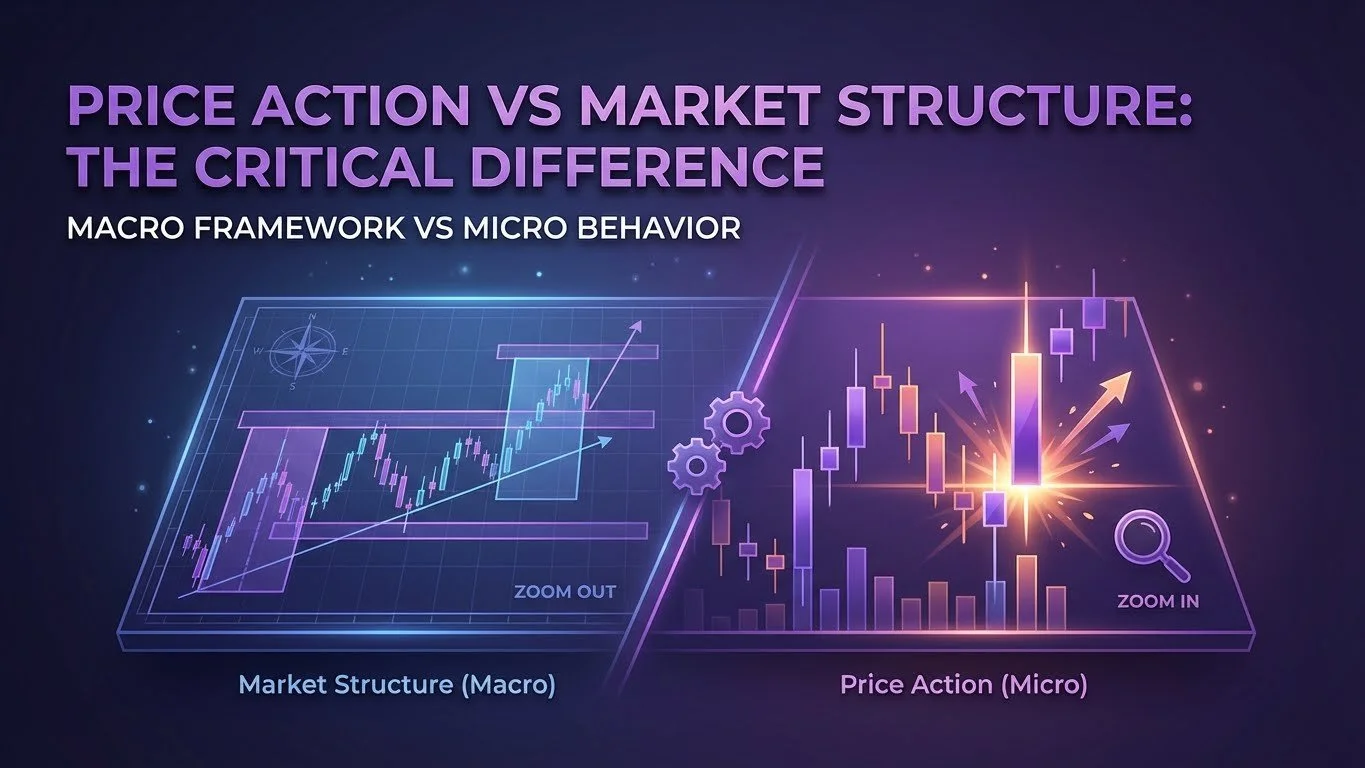
Price Action vs Market Structure: The Critical Difference Every Trader Must Understand
Many traders confuse price action with market structure—but they're not the same thing. Market structure shows you WHERE to look (the macro view of trends and key levels), while price action tells you WHEN to act (the micro view of candle behavior at those levels). This guide breaks down how to use both perspectives together so you can make more informed trading decisions at every level on your chart.

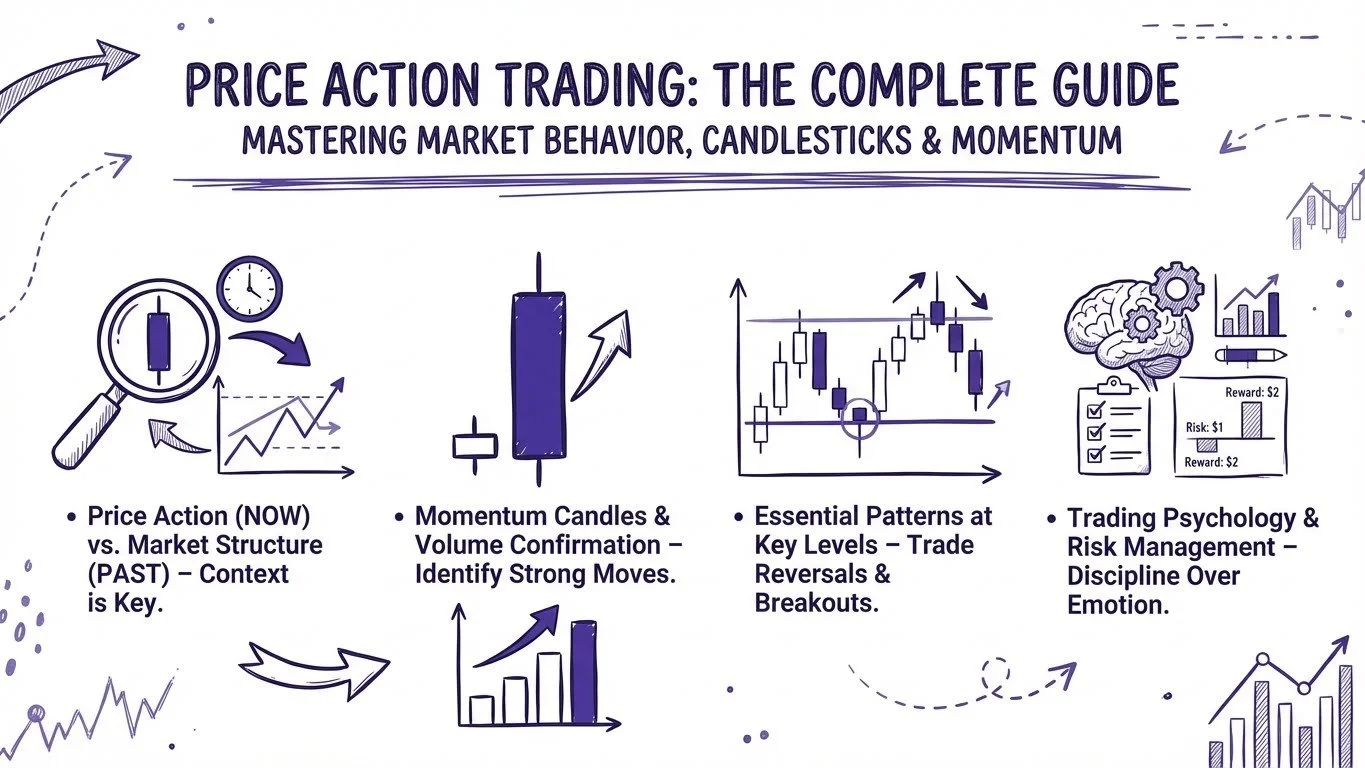
Price Action Trading: The Complete Beginner to Expert Guide (2026)
Learn how to read price charts like a professional trader. This complete guide covers candlestick patterns, momentum candles, support and resistance integration, breakout strategies, and a proven 6-step framework to find high-probability trades—no complex indicators required.

TradingView Plans Compared: Free vs Essential vs Plus vs Premium vs Ultimate (2026 Guide)
Compare all 5 TradingView plans for 2026. Learn which subscription fits your trading style, why Plus is a waste of money, and when Premium is worth it.

TradingView Black Friday 2025: Up to 80% Off + Extra Month Free (LIVE NOW!)
TradingView's Black Friday 2025 sale is officially LIVE with up to 80% off annual subscriptions—the biggest discount event of the year. This comprehensive guide covers current pricing, how to claim your deal, and strategies to maximize your savings on Premium, Plus, Essential, and Ultimate plans.

TradingView Black Friday 2025: Up to 80% Off Annual Plans + Complete Pricing Guide
TradingView's Black Friday 2025 sale offers up to 80% off annual plans plus 1 free month. Compare all tiers and find the perfect plan to save hundreds on professional charting tools.

What is Liquidity in Trading? A Complete Guide for Beginners
Learn what liquidity in trading means and why it separates profitable traders from losing ones. Discover how to identify liquid markets and avoid costly slippage.

TradingView Black Friday 2025: Up to 70% Off + 1 Month Free Expected (Sale Starts November 21)
TradingView's Black Friday 2025 sale launches November 21 with up to 70% off Premium plans plus one month free - dropping annual costs from $719 to ~$180. This once-per-year sale saves over $500 on professional charting tools. Start your free trial now and lock in Black Friday pricing on launch day.

Market Structure Trading: How to Identify Trends, Reversals, and High-Probability Setups
Discover the complete market structure trading strategy for 2025. Learn how to identify uptrends and downtrends, spot Break of Structure (BOS) and Change of Character (CHoCH) patterns, and combine market structure analysis with Smart Money Concepts to trade alongside institutions.

Best Crypto Trading Platforms for 2025: Expert Comparison & Review
Discover the top 5 crypto trading platforms for 2025 in this comprehensive comparison. From Bybit's $30,000 bonuses for advanced traders to Binance's unmatched liquidity and 350+ cryptocurrencies, Bitunix's NO KYC privacy trading, Coinbase's beginner-friendly interface, and Kraken's perfect security record—learn which exchange matches your trading style, experience level, and goals. Compare fees, features, and exclusive bonuses to make an informed decision.

Hedge Trading Strategy Explained: How Smart Traders Made Money When the Market Crashed
When Trump's tariff announcements crashed the market, smart traders actually made money while others panicked. Discover the hedge trading strategy that protects your long-term positions from short-term volatility without forcing you to sell.

InvestingPro Black Friday 2025: Unlock Up to 60% Off the Best AI-Powered Stock Research Platform
InvestingPro's Black Friday 2025 sale is here with up to 60% off plus an exclusive 15% stacking discount. Discover how AI-powered stock picks with a 97.22% hit rate and institutional-grade research tools can help you make smarter investment decisions.

Order Block Trading Strategy: A Complete Guide to Smart Money Concepts (2025)
Discover how to identify order blocks, the footprints of institutional traders, and use them to trade alongside smart money. Learn the complete strategy with entry techniques, risk management, and volume confirmation methods.

The Ultimate Order Flow Trading Course: Full Guide 2025
Discover how order flow trading reveals the hidden battle between buyers and sellers inside every candlestick, giving you an edge most traders never see.

Binance Tutorial for Beginners 2025: Complete Step-by-Step Guide
New to Binance? This step-by-step tutorial walks you through everything from account creation to using powerful trading indicators like MACD and Fibonacci. Plus, save 10% on all trading fees with referral code XJC7FO2K.

The Complete Day Trading Course for Beginners: Master Stocks, Crypto, and Forex in 2025
Whether you're looking to trade stocks, cryptocurrencies, or forex, this comprehensive guide will teach you everything you need to know about day trading. By the end of this article, you'll understand how to read candlestick charts, identify high-probability patterns, and use the same technical analysis tools that professional traders rely on. Most importantly, you'll learn multiple day trading techniques that can help you profit in any market condition, whether prices are rising or falling.

4 MACD Indicator Settings That Can Transform Your Trading Results
Most traders use the default MACD settings - but professionals know better. Discover 4 powerful MACD configurations that can help you catch moves earlier, spot divergences automatically, and simplify your charts for faster decision-making. Learn which settings match your trading style.

Supply and Demand Trading: The Ultimate Guide to Mastering Price Movements
Supply and demand drive every price movement in financial markets. Learn how to identify institutional footprints, draw high-probability zones, and trade alongside smart money in stocks, forex, and crypto using proven strategies that can improve your trading results.

Swing Trading Masterclass: The Complete Guide from Beginner to Advanced
Swing trading offers a balanced approach to the markets, holding trades for days or weeks instead of hours. This comprehensive guide covers everything from basic concepts to advanced indicators with exact settings, designed to help you develop trading skills that fit your lifestyle.

The Complete Trading Indicators Masterclass: Transform Your Technical Analysis in 2025
Discover the exact indicator settings used by professional traders: RSI 7-period for momentum, MACD 3-10-16 for trends, Fibonacci golden zones for reversals, and ATR for perfect stop losses. This comprehensive guide reveals advanced confluence strategies that can help improve your technical analysis across stocks, crypto, and forex markets.
