
Master Market Structure Trading in 2025: Shifts, Breaks, BoS, CHoCH, and Trends
Understanding market structure is critical to making informed trading decisions and, ultimately, making money in any market. Many traders waste time looking for the perfect indicator that never loses, but such a thing doesn’t exist. Just as you can't expect to be a successful doctor or lawyer without extensive study, the same principle applies to trading. You need to put in the work and take your time to learn how markets move. This blog post will guide you through the essential concepts of market structure, providing a solid foundation for technical analysis.
Key Takeaways
- Fundamental Pattern Recognition: Master the ABCD pattern—Impulse, Pullback, and Continuation—to grasp the core of market structure across all timeframes.
- Smart Money Dynamics: Understand how large market players create pullbacks by buying in stages, offering insight into optimal entry points.
- Fractal Market Behavior: Recognize that market patterns repeat across different timeframes, allowing you to apply strategies universally.
- Technical Confirmation Tools: Leverage indicators such as MACD, Fibonacci retracement, and Bollinger Bands to validate pullbacks, trend climaxes, and breakouts.
- Multi-Timeframe Analysis: Combine higher timeframe trends with lower timeframe precision to enhance the accuracy of your trade entries and exits.
- BoS and CHoCH Insights: Distinguish between Breaks of Structure (BoS) and Changes of Character (CHoCH) to effectively identify trend continuations or potential reversals.
The Fundamental Trend Pattern (ABCD Pattern)
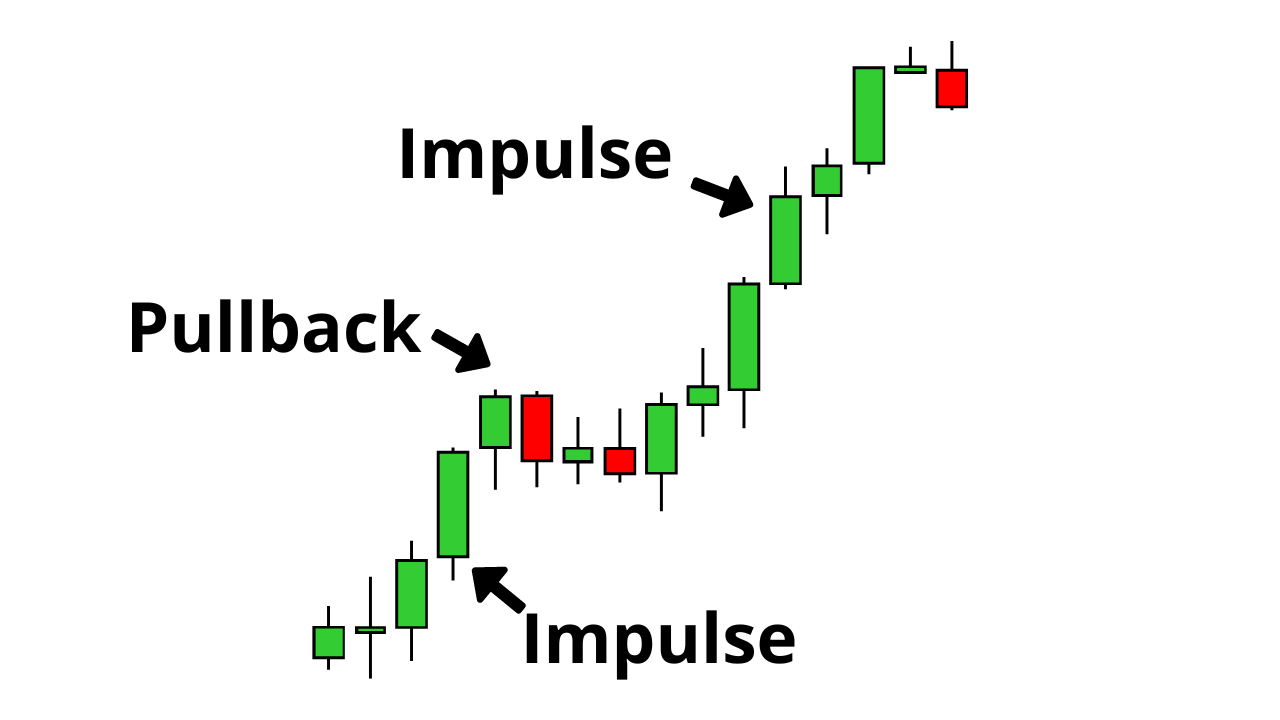
The ABCD pattern is a simple yet powerful concept at the heart of all market structure analysis. Markets tend to move in this fundamental pattern, regardless of the market or timeframe. Here's a breakdown of the pattern:
Impulse Move (A to B): A sharp move in one direction, often called an impulse or trend leg.
Pullback (B to C): A move in the opposite direction, where the market rests before the next impulse.
Continuation (C to D): The market resumes its original direction after the pullback.
Understanding this pattern helps traders anticipate market movements and make more informed decisions. Even complex theories like Elliott Wave Theory and Gann Theory are built on this fundamental pattern.
How Smart Money Moves Price
Large market players like banks and hedge funds can't buy or sell large quantities of assets at once without significantly moving the market. Instead, they buy in stages, creating impulse moves and pullbacks. Here’s a simplified explanation:
Buying in Stages: Large players buy a bit at a time to avoid driving the price up too quickly.
Creating Pullbacks: When they pause buying, the price often pulls back, allowing them to buy more at a lower price.
Understanding this behavior helps you align your trades with these large actors, giving you a strategic edge.

Smart Money, such as banks and hedge funds, cannot buy or sell substantial quantities of assets all at once without causing significant market movements.
Conclusion: Markets are Fractal
Markets are fractal, meaning patterns repeat across different timeframes. This fractal nature allows strategies that work on one timeframe to often work on others. Recognizing this can help you apply the concepts you learn universally.
Key Takeaway:
Patterns Repeat: The same market patterns appear across different timeframes.
Universal Application: The strategies you learn can be applied to various timeframes and markets.
Impulsive Moves
An impulsive move is characterized by large, strong candles indicating strong momentum. These moves are essential to identify, as they often indicate the direction of the trend. Use tools like the MACD indicator to help identify these moves.
My Special MACD Settings
Fast Length: 3
Slow Length: 10
Signal Smoothing: 16
MA Type: SMA
These settings help highlight impulsive moves more clearly, making it easier to identify trading opportunities.
Effective Trading Strategy: Pullbacks
Trading pullbacks following strong impulsive moves is one of the most effective strategies. However, be cautious of trend climaxes, where an extended impulsive move can signal the end of a trend. Use indicators like the Bollinger Bands to help identify these scenarios.
Impulsive Moves and Pullbacks
Identifying Trend Climaxes
A trend climax occurs when an impulsive move extends too far, often leading to a sharp reversal. Look for signs like:
Parabolic Price Movement: Rapid price increases without significant pullbacks.
Candles Outside Bollinger Bands: Candlesticks that close entirely outside the bands can indicate an overextended trend.
Pullbacks (Retracements & Consolidations)
Pullbacks, or retracements, are periods where the price consolidates after an impulsive move. They can be simple (a straight line) or complex (multiple smaller moves). Analyzing the depth of pullbacks with tools like Fibonacci retracement can help you predict where the price is likely to reverse.
Exercise: Using Fibonacci
Identify impulsive moves and pullbacks, then use the Fibonacci tool to see how many of these pullbacks reverse within the 38.2% to 61.8% range. This exercise helps you understand common reversal points.
Measured Move Objective (MMO)
A measured move objective is a common target for trades, where the length of the initial impulsive move is projected from the low of the pullback. This technique is widely used in technical analysis to set target levels.
How to Apply MMO
Measure the Initial Move: Measure the length of the impulsive move.
Project the Move: Apply this measurement from the low of the pullback to set a target.
Multi-Timeframe Analysis
Analyzing multiple timeframes can improve your trading accuracy. For instance, a pullback on a higher timeframe that aligns with an impulsive move on a lower timeframe can provide a high-probability trade setup.
Practical Application
Identify the Trend on Higher Timeframe: Determine the overall trend direction on a daily or weekly chart.
Zoom In for Entries: Use a lower timeframe (e.g., 4-hour or 1-hour) to find precise entry points that align with the higher timeframe trend.
Uptrend and Downtrend Market Structure
Uptrend Market Structure (Basic and Advanced)
In an uptrend, prices print higher highs and higher lows. Identify these key points to confirm the trend. For example, if a higher low forms, look for the price to break the previous high to continue the uptrend.
Key Points in an Uptrend
Higher Highs and Higher Lows: Confirm the trend by identifying consecutive higher highs and higher lows.
Break of Structure (BoS): A break above the previous high confirms the continuation of the uptrend.
Downtrend Market Structure (Basic and Advanced)
In a downtrend, prices print lower highs and lower lows. The same principles apply but in reverse. Identify the lowest points and ensure that any moves break below these points to confirm the continuation of the downtrend.
Key Points in a Downtrend
Lower Highs and Lower Lows: Confirm the trend by identifying consecutive lower highs and lower lows.
Break of Structure (BoS): A break below the previous low confirms the continuation of the downtrend.
BoS and CHoCH (Market Structure Breaks)
Break of Structure (BoS): Occurs when the price breaks above or below a key level, indicating a continuation of the trend.
Change of Character (CHoCH): Indicates a potential trend reversal when the price fails to continue in the direction of the previous trend.

Break of Structure (BoS)

Change of Character (CHoCH)
Identifying BoS and CHoCH
BoS: Look for a clear break above a previous high (uptrend) or below a previous low (downtrend).
CHoCH: Look for a failure to break above a previous high (uptrend) or below a previous low (downtrend). The CHoCH is confirmed when the price fails to hold lows in an uptrend or highs in a downtrend.
Strong and Weak Highs & Lows
Strong High/Low: A high or low that results in a break of structure.
Weak High/Low: A high or low that fails to break the structure.
Practical Tips
Identify Strong Points: Look for highs or lows that lead to a significant price movement breaking previous structures.
Avoid Weak Points: Be cautious of highs or lows that do not result in significant price changes, as they might not provide reliable trading signals.
Major and Minor Market Structure
Major market structure refers to key levels on higher timeframes, while minor market structure refers to levels on lower timeframes. Using both can improve your trading decisions, providing a clearer picture of the market’s direction.
Multi-Timeframe Analysis
Major Structure on Higher Timeframes: Identify the overall trend on daily or weekly charts.
Minor Structure on Lower Timeframes: Zoom in to 4-hour or 1-hour charts to find more detailed entry and exit points.
The major structure can also be identified on lower time frames like the 4-hour and 1-hour chart, but then your lower timeframe has to be even lower like the 15-min or 5-min chart.
Example
On a daily chart, Bitcoin might be in a downtrend with lower highs and lower lows. Zooming into a 4-hour chart, you might find an uptrend within that downtrend, offering short-term trading opportunities while staying aware of the broader trend.
Market Structure Trading FAQ
FAQ: Market Structure Trading
A: The ABCD pattern consists of an impulse move (A to B), a pullback (B to C), and a continuation (C to D). This fundamental framework helps traders anticipate market moves regardless of the timeframe.
A: Large market players (smart money) typically buy in stages. Their gradual accumulation creates impulsive moves followed by pullbacks, providing strategic entry opportunities for traders.
A: A BoS indicates a clear break in the established price structure that confirms the continuation of the trend, whereas a CHoCH signals a potential reversal when the price fails to maintain momentum.
A: Because markets are fractal, patterns repeat across different timeframes. Multi-timeframe analysis helps traders identify these recurring patterns, ensuring more precise entries and exits.
A: Fibonacci retracement levels (commonly 38.2% to 61.8%) help pinpoint potential reversal zones during pullbacks. This tool is useful for confirming entry points after an impulsive move.
Quiz: How well do you understand Market Structure Trading?
Quiz: Test Your Market Structure Trading Knowledge
Conclusion
Understanding market structure is the foundation of successful trading. By recognizing patterns, identifying impulsive moves, and analyzing pullbacks, you can make more informed trading decisions. Applying these concepts across different timeframes and using tools like the MACD and Fibonacci retracement can enhance your trading strategy. Stay tuned for more chapters in this comprehensive market structure trading course.
Read More on Mind Math Money
Break of Structure & CHoCH Trading Strategy
Discover advanced techniques for identifying market shifts with our comprehensive guide to BoS and CHoCH trading.
Read MoreUnderstanding BoS & CHoCH in Trading
Learn the fundamentals of market structure with insights into breaks of structure and changes of character.
Read MoreLiquidity Grab in Trading
Explore how liquidity grabs impact market dynamics and discover strategies to capitalize on these movements.
Read MoreAuto Chart Patterns Indicator
Enhance your chart analysis with our in-depth guide on TradingView’s auto chart patterns indicator.
Read More