
Pullback Trading Strategy Explained: Simple and Complex Pullback Trading Guide
Pullbacks—also known as retracements or consolidations—are an essential concept in trading. In this guide, we’ll dive into what pullbacks are, the key characteristics to look for, and strategies for trading both simple and complex pullbacks effectively. Whether you're in forex, crypto, or stock trading, mastering pullback trading strategies can enhance your decision-making and profitability.
Key Takeaways
- Understanding Pullbacks: Recognize pullbacks as temporary counter-trend moves—characterized by smaller candles, mixed colors, and multiple wicks—that signal a pause before the primary trend resumes.
- Simple vs. Complex Pullbacks: A simple pullback is a clean, single reversal, while a complex pullback involves multiple counter moves. Mastering both types can unlock valuable trading opportunities.
- Effective Entry Strategies: Combine trend identification with technical indicators such as moving averages, Fibonacci retracement, and candlestick patterns to pinpoint optimal entry points after a pullback.
- Risk Management & Tools: Enhance your strategy with robust risk management and leverage platforms like TradingView to validate market conditions
What is a Pullback?
A pullback is a temporary reversal that goes against the current trend. Think of it as a pause in a trend—a moment where price moves in the opposite direction before potentially continuing in the original trend’s direction. For instance, during an uptrend, you might see a brief move downwards; this is the pullback.
Example of a Pullback
Consider a market where the price moves upwards with strong momentum (known as the impulsive move). After this move, a brief consolidation or minor reversal occurs before the trend resumes. This minor reversal against the primary trend is the pullback.
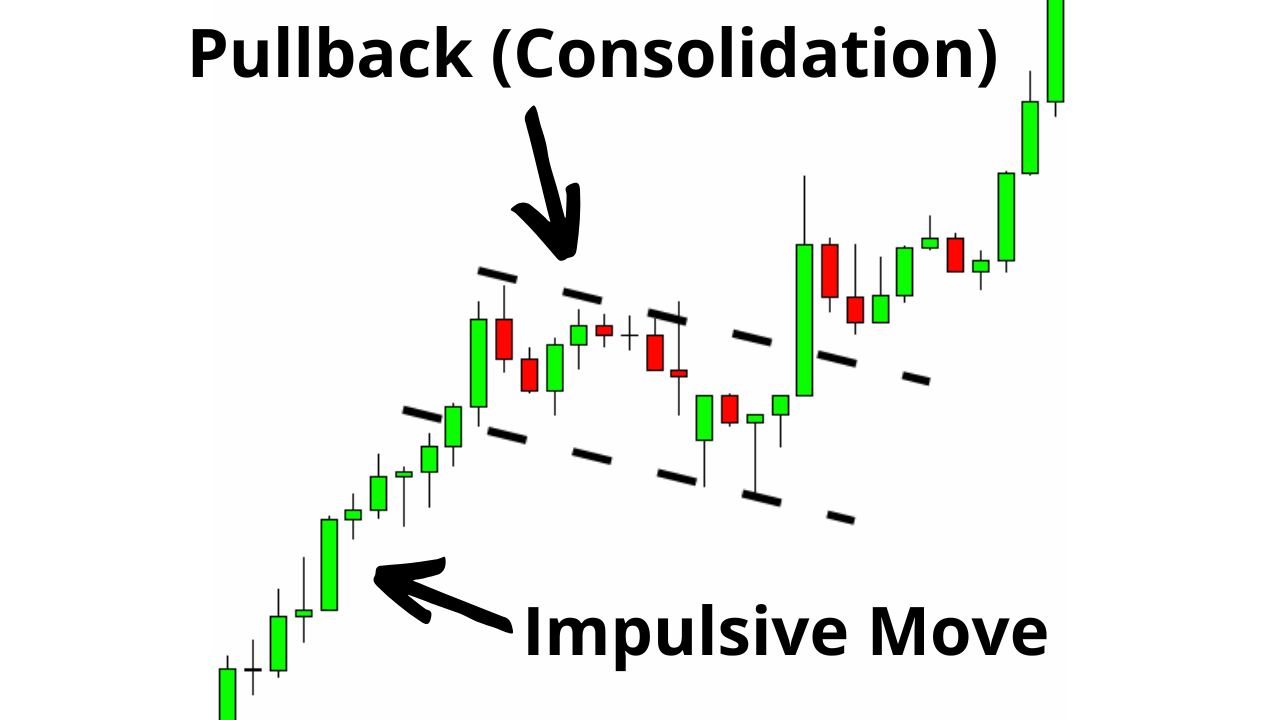
What is a Pullback in Trading? A pullback is a brief, counter-trend movement within an ongoing trend, providing a temporary pause before the trend potentially resumes.
Key Signs of a Pullback
Identifying a pullback accurately is critical. Here are some indicators to help you spot them:
1. Small Candle Bodies
Pullbacks often have small candle bodies compared to the previous impulsive move. It normal to find spinning top and doji candles within the pullback.
Example: In an uptrend, if the initial move shows large green candles, a pullback might show smaller, mixed-color candles.
2. Mixed Candle Colors
Look for candles of different colors (e.g., both red and green in an uptrend).
This indicates a pause in the trend, with buying and selling pressure balancing temporarily.
3. Presence of Wicks
Pullbacks often show multiple wicks—both upper and lower—indicating price indecision.
Large wicks on either side of a candle body signal potential reversals within the pullback.
Simple vs. Complex Pullbacks
Understanding the difference between simple and complex pullbacks is essential for refining your trading strategy. Here’s a breakdown:

Complex vs Simple Pullbacks in Trading: A simple pullback shows a single, straightforward counter-trend move, while a complex pullback contains multiple counter-trend moves, creating a minor trend within the pullback.
Simple Pullbacks
A simple pullback involves a single counter-trend move. This looks like a clean, straight retracement in the opposite direction, followed by a continuation of the original trend.
Example: In an uptrend, the price makes a minor, straight-line dip before resuming the upward momentum.
Complex Pullbacks
Complex pullbacks have multiple counter-trend moves within them. Instead of a single reversal, a complex pullback forms a structure with minor highs and lows within the overall pullback.
Example: In an uptrend, instead of a single dip, the price might move down, then up slightly, then down again, creating a miniature downtrend within the pullback.
Why Trade Complex Pullbacks? While they are more challenging to spot, complex pullbacks offer high reward potential. Once mastered, they provide solid opportunities for strategic entries and exits.
How to Trade Pullbacks
Pullbacks offer prime entry opportunities in trending markets. Here’s a pullback trading strategy to consider:
1. Identify the Trend
Confirm the primary trend direction (uptrend or downtrend).
Use a tool like TradingView to visualize and analyze trends accurately. (Using my affiliate link can help support this blog!)
Learn about concepts like market structure and price action for more accurate trend analysis.
2. Wait for the Pullback
In an uptrend, wait for a minor reversal or consolidation that suggests a pullback.
Look for smaller candles, mixed colors, and multiple wicks.
3. Enter on Continuation Confirmation
Once the pullback shows signs of ending (e.g., a strong candle resuming the primary trend), consider entering the trade.
For serious traders, tools like InvestingPro can help monitor economic data and market sentiment, supporting your decision to enter or exit based on trend direction.
Pullback Entry Strategies
Knowing when to enter during a pullback can make or break a trade. Here are some common strategies:
1. Moving Average Support/Resistance
In an uptrend, you might wait for the pullback to reach a key moving average line (e.g., 20-day or 50-day). If it bounces from there, this can signal a good entry point.
In downtrends, look for the pullback to reach the moving average from below, suggesting a resistance level.
Important: Using moving averages as support and resistance has its limitations, and it’s a strategy I generally avoid. However, I’m including it here because it’s widely used and many traders claim to find success with it.
2. Fibonacci Retracement Levels
Use Fibonacci levels to identify possible support or resistance during pullbacks. Common retracement levels include 38.2%, 50%, and 61.8%.
Enter when the price respects a Fibonacci level and shows signs of resuming the trend.
3. Candlestick Patterns
Look for reversal patterns like engulfing candles, doji candles, or hammer patterns as confirmation to enter after a pullback.
Ensure the pattern aligns with the primary trend direction to increase the chance of success.
Mastering Pullbacks for Profitable Trades
Understanding and mastering pullbacks can make your trading strategy more resilient and adaptable. By recognizing the key characteristics of pullbacks and differentiating between simple and complex types, you’ll be better equipped to seize trading opportunities confidently.
Test Your Pullback Trading Skills! (QUIZ)
Quiz: Test Your Pullback Trading Knowledge
Pullback Trading Strategy FAQ
FAQ: Pullback Trading Strategy Questions
A pullback is a temporary reversal within an ongoing trend, where price briefly moves against the prevailing momentum. This creates an opportunity to enter trades at a more favorable price before the trend resumes—core to any pullback trading strategy.
While pullbacks are short-term corrections lasting days or weeks, reversals signal a longer-term trend change. Key indicators like volume, candlestick patterns, and price action help distinguish a mere pullback from a full-blown reversal.
Traders commonly use moving averages, RSI, and Fibonacci retracement levels to spot pullbacks. For instance, an RSI pullback strategy combined with Fibonacci levels (38.2%, 50%, and 61.8%) can highlight potential entry points within a trending market.
Fibonacci retracement levels serve as key support or resistance zones during a pullback. By identifying levels such as 38.2%, 50%, and 61.8%, you can determine where the price might reverse and resume the trend—ideal for setting entry points in your pullback trading strategy.
Pullback trading is most effective in clear trending markets. In sideways or range-bound markets, these strategies may unde
Read Next
How to Draw Fibonacci Retracement Correctly in TradingView
Improve your chart analysis with our detailed guide on drawing Fibonacci retracement levels accurately in TradingView.
Read MoreLinda Raschke Trading Strategy: MACD Indicator Settings
Discover key MACD indicator settings inspired by Linda Raschke's strategy for trading stocks, forex, and crypto effectively.
Read MoreVolume Analysis in Trading: A Guide
Master the art of volume analysis and learn how to use volume indicators to spot trends and reversals in the market.
Read More