
How to Use Fibonacci Retracement in TradingView: Draw Fibonacci Levels, Golden Zone and Trading Strategy
Learn how to implement complete Fibonacci trading strategies with the Golden Zone in TradingView.
Last Updated: March 28, 2025
Fibonacci retracement is a technical analysis tool used to identify potential support and resistance levels where price might reverse
The most significant Fibonacci levels that traders watch closely are 38.2%, 50%, and 61.8%
In an uptrend, draw Fibonacci from swing low to swing high; in a downtrend, draw from swing high to swing low
There are two primary drawing methods: wick-to-wick (using the extreme price points) and close-to-close (using closing prices)
Consistency is crucial — always use the same method (wick-to-wick or close-to-close) throughout your analysis for reliable results
Drawing Fibonacci retracement levels correctly is a crucial skill for any trader looking to identify potential areas in the market where the price is likely to reverse. Fibonacci retracements are a popular tool used to predict the future direction of a market after a significant move up or down. In this guide, we'll walk you through how to draw Fibonacci retracement levels correctly, ensuring you can apply this tool effectively in your trading strategy.
Watch “How to Draw FIBONACCI Retracement For Trading” on YouTube
Fibonacci retracement is a method of technical analysis for determining support and resistance levels, or in other words, areas on the chart where the price is likely to bounce. They are based on the Fibonacci sequence, a series of numbers where each number is the sum of the two preceding ones. In trading, the most commonly used Fibonacci ratios are 23.6%, 38.2%, 50%, 61.8%, and 100%.

The Fibonacci Trading Levels: 0.236, 0.382, 0.5, 0.618, and 0.786 are all percentages. For example: 0.618 stands for 61.8%.
Identify Potential Reversal Zones: Fibonacci levels can help pinpoint areas where the price might reverse.
Set Entry and Exit Points: Traders can use these levels to determine optimal entry and exit points.
Complement Other Analysis Tools: When combined with other indicators, like the MACD or the RSI Indicator, Fibonacci retracements can potentially enhance your trading strategy.
The right tools make all the difference when applying Fibonacci retracements
Before drawing Fibonacci retracement levels, determine whether the market is in an uptrend or a downtrend.
Uptrend: A series of higher highs and higher lows.
Downtrend: A series of lower highs and lower lows.
To learn more about trends and how to determine if the price is in an uptrend or downtrend, read more about market structure.
Swing High: The highest point reached before the market starts moving downward.
Swing Low: The lowest point reached before the market starts moving upward.
There are two primary methods for drawing Fibonacci retracement levels:
Wick-to-Wick Method: Draw from the extreme high and low points using the candlestick wicks.
Close-to-Close Method: Draw from the closing prices of the swing high and swing low.
The key is to be consistent with the method you choose throughout your analysis.
Select the Fibonacci Retracement Tool: In TradingView, click on the “Gann and Fibonacci Tools“ button and then select “Fib Retracement” from the toolbar.
Draw from Swing Low to Swing High:
Wick-to-Wick: Click on the lowest wick of the swing low and drag up to the highest wick of the swing high.
Close-to-Close: Click on the closing price of the swing low candle and drag up to the closing price of the swing high candle.
Extend to the Right: Drag the Fibonacci levels to the right to cover future price action.

How to Draw Fibonacci Retracement in Uptrend: Draw it from a Swing Low to a Swing High.
Select the Fibonacci Retracement Tool.
Draw from Swing High to Swing Low:
Wick-to-Wick: Click on the highest wick of the swing high and drag down to the lowest wick of the swing low.
Close-to-Close: Click on the closing price of the swing high candle and drag down to the closing price of the swing low candle.
Extend to the Right.
After drawing, the Fibonacci retracement levels will appear on your chart. These levels indicate potential support and resistance areas where the price might retrace before continuing in the trend direction.
0.382 (38.2%)
0.500 (50%)
0.618 (61.8%)
These levels are the most significant and are closely watched by traders.
Let's apply what we've learned using Bitcoin as an example.
Identify the Uptrend: Suppose Bitcoin is in an uptrend, moving from a swing low to a swing high.
Find Swing Points: Locate the swing low at $30,000 and the swing high at $40,000.
Draw Fibonacci Retracement:
Wick-to-Wick: From the lowest wick at $30,000 to the highest wick at $40,000.
Close-to-Close: From the closing price at $30,500 to the closing price at $39,500.
Analyze the Levels: Observe how the price retraces to the 38.2% or 50% levels before resuming the uptrend.
Remember, consistency is key. Stick to either wick-to-wick or close-to-close method throughout your analysis.
Combine with Other Concepts: Use Fibonacci retracements alongside other technical analysis concepts like price action and market structure.
Watch for Confluence: The more indicators that point to the same level, the stronger that level is likely to be.
Stay Consistent: Always use the same method (wick-to-wick or close-to-close) to maintain consistency in your analysis.
Open TradingView: Log in to your TradingView account and open the chart of the asset you're analyzing.
Select the Tool: Click on the 'Fib Retracement' tool in the toolbar.
Draw on the Chart: Follow the steps outlined above for either an uptrend or downtrend.
Customize Levels: You can customize which Fibonacci levels are displayed in the tool's settings.
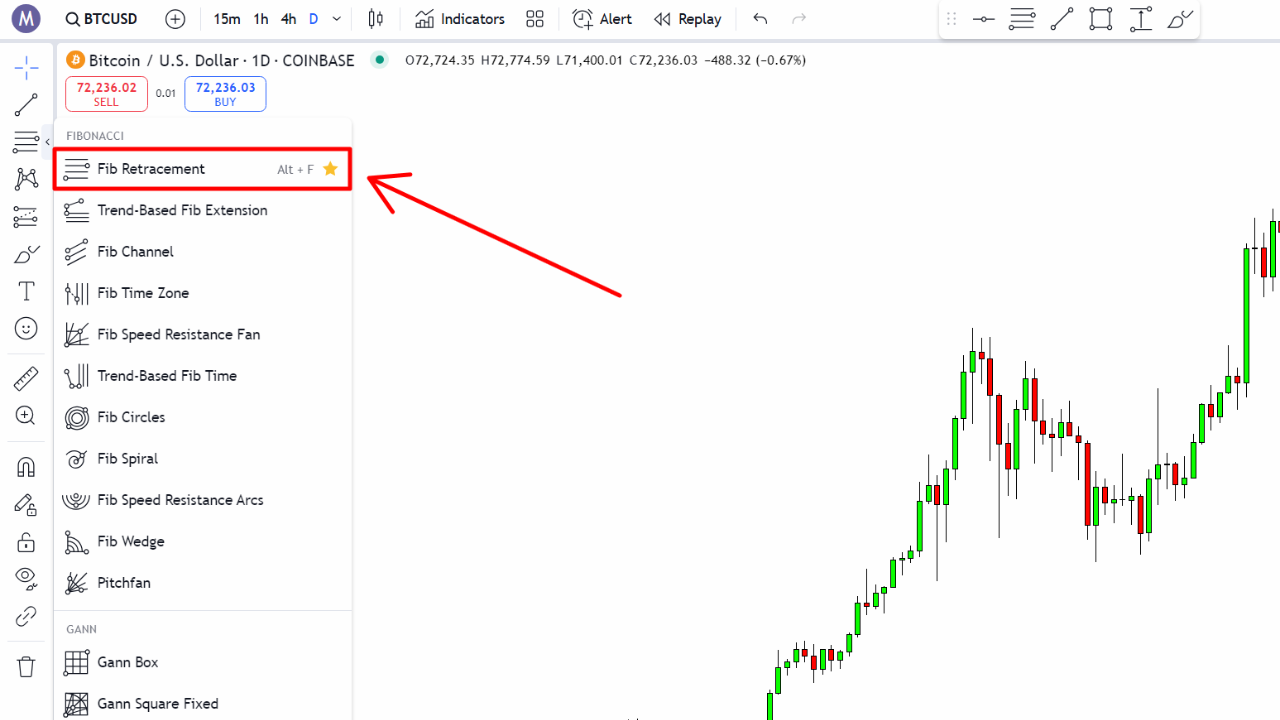
How to access the Fibonacci Retracement tool in TradingView: Select 'Fib Retracement' from the toolbar on the left.
The most important Fibonacci retracement levels are 38.2%, 50%, and 61.8%. These levels are closely watched by traders and often act as significant support or resistance areas. The 50% level, while not technically a Fibonacci ratio, is included because it's a psychologically important level where price often reacts. The 61.8% level (the Golden Ratio) is considered especially powerful in technical analysis.
Yes, Fibonacci retracements can be effective for day trading across various timeframes. Day traders often use Fibonacci tools on 5-minute, 15-minute, or hourly charts to identify potential reversal zones after price moves. These levels can help determine entry points, stop-loss levels, and take-profit targets. For day trading, you'll want to focus on recent swing highs and lows rather than longer-term price movements.
You've drawn your Fibonacci retracement correctly if: 1) In an uptrend, you've drawn from the swing low to the swing high; 2) In a downtrend, you've drawn from the swing high to the swing low; 3) You've consistently used either the wick-to-wick or close-to-close method; 4) The tool extends to the right to cover future price action. The ultimate validation comes when price actually respects these levels by bouncing off them or showing a reaction at these points.
For best results, combine Fibonacci retracements with other technical analysis tools. When Fibonacci levels coincide with other indicators like trend lines, moving averages, RSI divergence, or key support/resistance zones, it creates "confluence" - multiple reasons to expect a reversal at that price level. These confluence zones typically provide higher-probability trading opportunities than using Fibonacci retracements in isolation.
Yes, many professional and institutional traders incorporate Fibonacci retracements into their trading strategies. While not every professional uses them, Fibonacci levels are respected in the market partly because they're widely used, creating a self-fulfilling effect. Institutional traders may use Fibonacci as part of their algorithmic trading systems, and the levels often align with key psychological price points. However, professionals typically use them as confirmation tools alongside other analysis methods rather than as standalone signals.
Mastering how to draw Fibonacci retracement correctly can be helpful for identifying key levels in the market. By consistently applying either the wick-to-wick or close-to-close method, you can enhance your trading strategy and make more informed decisions.
Learn how to implement complete Fibonacci trading strategies with the Golden Zone in TradingView.
Discover how to configure your TradingView Fibonacci settings to highlight the powerful Golden Zone.
Take your Fibonacci knowledge to the next level with this complete guide covering both retracements and extensions.
Master the art of identifying swing highs and lows - crucial for correctly drawing Fibonacci retracements.
I bought my first stock at 16, and since then, financial markets have fascinated me. Understanding how human behavior shapes market structure and price action is both intellectually and financially rewarding.
I’ve always loved teaching—helping people have their “aha moments” is an amazing feeling. That’s why I created Mind Math Money to share insights on trading, technical analysis, and finance.
Over the years, I’ve built a community of over 200,000 YouTube followers, all striving to become better traders. Check out my YouTube channel for more insights and tutorials.