
Understanding Strong Highs, Weak Highs, Strong Lows, and Weak Lows in Market Structure Trading
Last Updated: November 5, 2025
When navigating market structure trading, understanding strong and weak highs and lows can enhance your strategy. At first, these concepts might seem complicated, but they are straightforward once explained. This article will guide you through identifying strong and weak highs and lows and their implications in trading.
Key Takeaways for Market Structure Trading
-
Strong Lows: Break prior resistance, signaling robust bullish momentum and prime buying zones in market structure
-
Weak Lows: Fail to surpass previous highs, indicating limited upward drive and a need for caution in trading
-
Strong Highs: Break through support levels, reflecting strong selling pressure and potential market downturns
-
Weak Highs: Don't clear earlier support, suggesting fragile bearish sentiment and possible trend reversals
-
Trading Application: Distinguishing these levels sharpens market structure analysis, improves entry/exit timing, and boosts risk management
What are Strong and Weak Lows?
A strong low is a low point in the market that causes a break of structure. This means the market move from this low is strong enough to break through previous resistance levels, showing a strong upward trend.
Example of a Strong Low:
When you see a break of structure (BoS), the low that caused this break is a strong low. If a market move starts at a low point and breaks through previous high points, this low is marked as strong.
Identifying Strong Lows:
If you see a low followed by a market move that surpasses previous highs, you label this low as strong.
A weak low is a low point that fails to break the structure. This means the upward movement from this low does not surpass previous high points or resistance levels, showing weak upward momentum.
Example of a Weak Low:
A low from which the market moves upward but fails to break the previous high or structure is considered weak.
Identifying Weak Lows:
If a market move from a low does not break previous highs, this low is marked as weak.
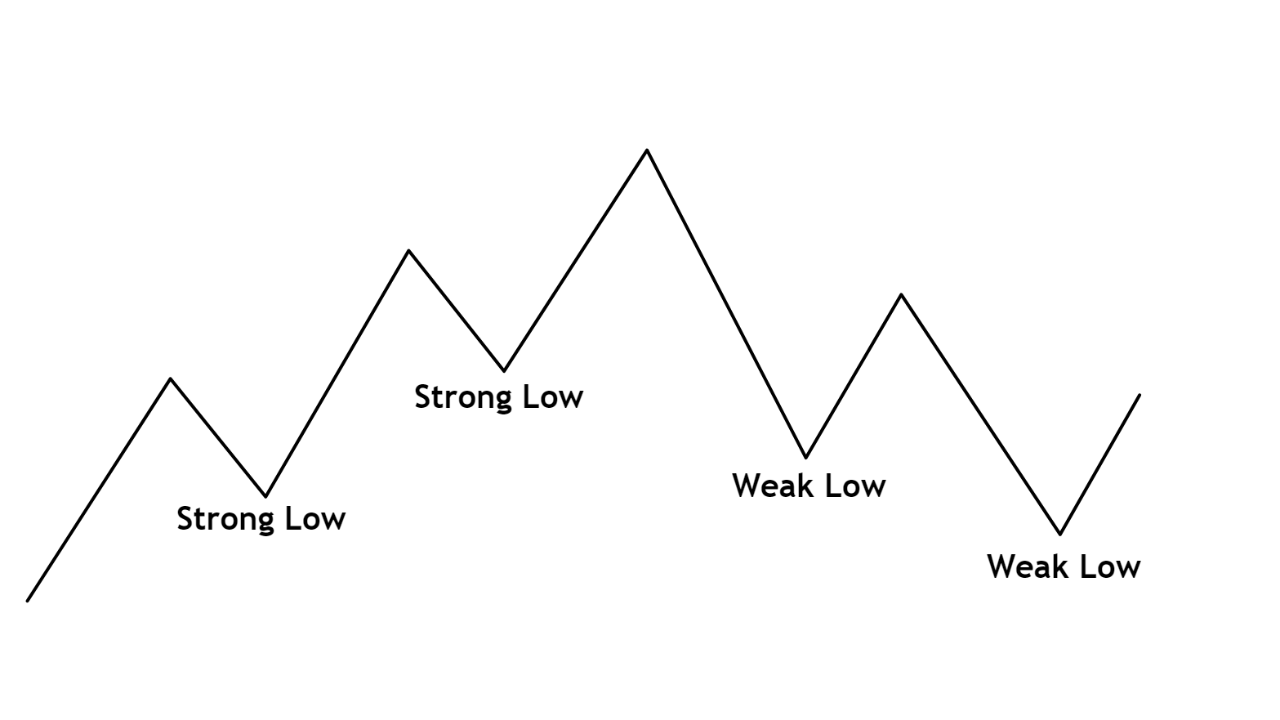
Strong Low and Weak Low
What are Strong and Weak Highs?
The opposite applies to highs. A strong high is a high point that causes a break of structure, showing a strong downward trend.
Example of a Strong High:
When a high point is followed by a market move that breaks below previous low points or support levels, this high is marked as strong.
Identifying Strong Highs:
If you see a high followed by a downward move that breaks previous support levels, this high is considered strong.
A weak high is a high point that fails to break the structure. This means the downward movement from this high does not surpass previous low points or support levels, showing weak downward momentum.
Example of a Weak High:
A high from which the market moves downward but fails to break the previous low or structure is considered weak.
Identifying Weak Highs:
If a market move from a high does not break previous lows, this high is marked as weak.

Weak High and Strong High
Practical Application in Trading
Quick Reference: Trading Decision Matrix
Strong Low
Weak Low
Strong High
Weak High
Pro Tip: Strong levels indicate higher probability setups with clearer market direction. Weak levels require additional confirmation before entry.
Understanding these concepts helps traders make better decisions about entry and exit points in the market. Identifying strong highs and lows can indicate potential reversal points or continuation patterns, optimizing trading strategies.
Strong Lows: Signal potential buying opportunities as they indicate strong upward momentum.
Weak Lows: Suggest caution as they indicate weak upward momentum.
Strong Highs: Signal potential selling opportunities as they indicate strong downward momentum.
Weak Highs: Suggest caution as they indicate weak downward momentum.
FAQ: Strong/Weak High/Low
FAQ: Mastering Strong & Weak Levels in Trading
What differentiates a strong low from a weak low in market structure?
A strong low breaks prior resistance, showcasing bullish momentum for trading, while a weak low fails to surpass previous highs, signaling limited upward potential.
How do strong highs influence market trends?
Strong highs break support levels, indicating significant selling pressure and potential bearish trends in market structure trading.
Why is distinguishing strong and weak levels crucial for traders?
It enhances market structure analysis, refines entry/exit points, and improves risk management for better trading decisions.
Can strong and weak levels vary across different timeframes?
Yes, a strong low on a daily chart may appear weak on a shorter timeframe if it doesn’t break key resistance, affecting trading strategies.
How can I apply strong and weak levels to my trading strategy?
Use strong lows as buy signals, strong highs as sell signals, and weak levels for caution, integrating with tools like RSI for precision in market structure.
Quiz: How Good Is Your Strong/Weak High/Low Knowledge?
Quiz: Test Your Market Structure Trading Skills
Conclusion
By learning to identify strong and weak highs and lows, traders can understand market dynamics better and make smarter decisions. This knowledge is part of a broader market structure trading strategy that can improve your trading performance.
BOS & ChOCH Trading Strategy
Master Break of Structure and Change of Character for precise market moves.
Swing Highs & Lows Guide
Learn to trade swing highs and lows effectively in any market.
Liquidity Grab Strategy
Understand liquidity grabs and how to use them in trading.
RSI Divergence Trading
Boost your strategy with RSI divergence in forex, crypto, and stocks.
InvestingPro - AI & Smart Money Trading
(Limited Time: Save 70% Today!)
Unlock cutting-edge trading strategies with InvestingPro.
TradingView - $15 Bonus & 30 Days Free
Access advanced charting tools and premium features.
Bybit Crypto - Up to $30,000 Bonus
Join Bybit for high-leverage crypto trading opportunities.
Want to join our learning journey?