
Volume Analysis in Trading: Volume Trading Strategy and Indicators for Stocks, Forex and Crypto.
Introduction
In the world of trading, technical analysis is built on two key pillars: price and volume. While most traders are well-versed in price action, volume often remains an underappreciated indicator of market strength. In this article, we will explore the importance of volume, how it works, and how you can leverage it to enhance your trading strategy. You’ll learn how to spot trends, identify reversals, and validate breakouts using volume analysis. Whether you are trading forex, stocks, or cryptocurrencies, understanding volume can help improve your win rate and overall trading performance.
In the sections below, we will cover:
What is Volume? – Define volume and its role in various markets.
How Volume Works – Discover the basics of volume indicators and how they are displayed.
Using Volume for Trend Analysis – Learn to interpret volume spikes during uptrends and downtrends.
Volume and Reversals – Identify signals for trend reversals by studying volume behavior.
Volume Divergences – Understand how to spot divergence between price and volume.
Volume in Breakouts – Validate breakouts by analyzing volume strength.
Volume and Support/Resistance – Integrate volume analysis with support and resistance for a comprehensive approach.
Read on to harness the power of volume trading and transform your technical analysis skills.
What is Volume?
Volume is simply defined as the number of assets that change hands during a specified time period. It represents the level of activity in the market and provides critical insights into the strength behind price movements.
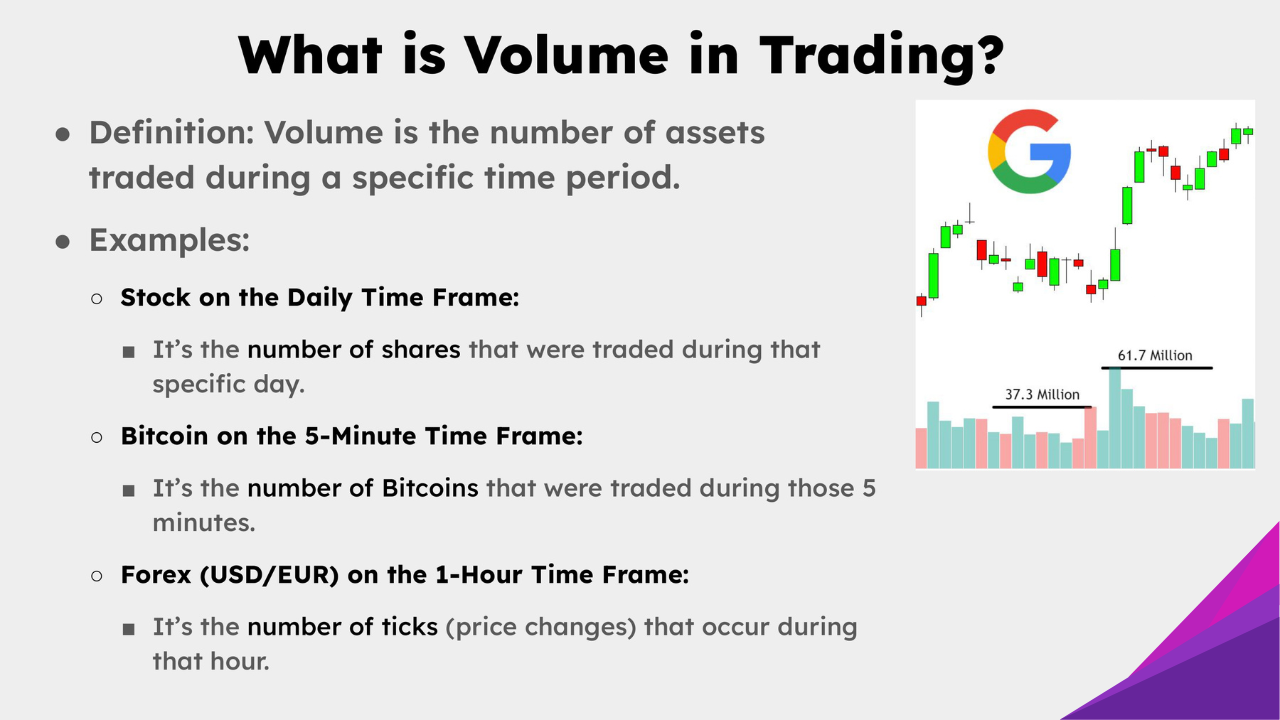
What is Volume in Trading? Volume is the number of assets (like stocks, crypto, or forex) trader during a specific time frame.
Volume in Different Markets
Stocks: Volume refers to the number of shares traded during a day or any chosen time frame.
Cryptocurrency: Here, volume denotes the number of coins or tokens exchanged within a period.
Forex: In foreign exchange, volume is often considered as the number of currency pairs that have been traded.
Understanding these fundamentals is crucial because volume helps differentiate between moves that are supported by genuine market participation and those that may lack significant backing.
How Volume Works
Volume indicators are one of the most powerful tools available on platforms such as TradingView. The standard volume indicator is displayed as vertical bars, with each bar’s height representing the traded volume over that period.
Reading the Volume Bars
Tall Bars: Indicate high trading volume. A tall green bar on an up day shows strong buying interest, whereas a tall red bar on a down day indicates significant selling pressure.
Small Bars: Represent lower trading volume. These bars suggest that fewer market participants are involved in that price movement.
An important aspect of volume analysis is that the color of the volume bar typically mirrors the candle’s color. This visual cue helps traders quickly identify whether the day's activity was dominated by buyers or sellers.
Always hover over a candle in your chart to view the exact volume traded. For instance, a day with a 447 million volume for Tesla compared to a day with only 69 million is a clear indicator of market participation.
Using Volume for Trend Analysis
Volume is a crucial factor in confirming the strength of a trend. Analyzing volume alongside price movements provides you with a deeper understanding of market dynamics.
Trends in an Uptrend
In an uptrend, look for:
Impulsive Moves: When the price increases, you want to see a corresponding spike in volume. This suggests that a strong number of buyers support the move.
Pullbacks: During pullbacks, volume should typically decrease, indicating that fewer traders are selling during minor retracements.
For example, on a daily forex chart of the Euro/USD pair, an impulsive upward move supported by high volume confirms the strength of the trend. As the price pulls back, a decline in volume reassures you that the retracement is only temporary, and the primary trend remains intact.
Trends in a Downtrend
The same logic applies inversely in a downtrend:
Impulsive Down Moves: Look for increasing volume during significant downward moves. This indicates that sellers are strongly backing the move.
Pullbacks: During upward corrections in a downtrend, decreasing volume suggests that the buyers are not enough to reverse the trend.
By incorporating volume analysis into your trend trading strategy, you can improve your confidence in the prevailing market direction.
Volume and Reversals
Volume analysis is equally powerful when identifying potential trend reversals. Reversals occur when the market shifts direction, and volume spikes can serve as early warning signals.
Key Points to Identify Reversals
Spikes in Volume: A sudden spike in volume during a price reversal can be a signal that a significant number of traders are entering the market with a new perspective.
Bearish Shooting Star: For example, when you see a red candle with a strong volume spike and a bearish shooting star pattern, it signals that sellers are overwhelming buyers and a reversal may be imminent.
Example in Action
Imagine a scenario where the price is rising gradually, but then a red candle with a massive volume bar appears. This candle marks the end of the uptrend, signaling that many sellers are stepping in. Even if the price later consolidates into a trading range, that volume spike was the crucial moment indicating a potential reversal.
Always annotate your charts when you observe a volume spike. Mark the candle with a clear note like "Potential Reversal" to remind you to review your strategy.
This annotation technique helps maintain a visual record and supports your technical analysis process.
Volume Divergences
Volume divergences occur when the price is moving in one direction while volume trends in the opposite direction. This divergence can serve as a red flag, indicating that the current move may not be sustainable.

Understanding Volume Divergence
Bearish Volume Divergence: Occurs when the price prints a higher high, but volume makes a lower high. This situation suggests that although the price is increasing, the buying interest is waning.
Bullish Volume Divergence: Conversely, if the price is making a lower low but volume is increasing, it may indicate that selling pressure is subsiding, and a reversal could be on the horizon.
Always compare the highs and lows of price action with corresponding volume bars. A divergence between the two can be one of the most reliable reversal signals.
By paying attention to these divergences, you can spot potential reversals earlier and adjust your trading strategy accordingly.
Volume in Breakouts
Breakouts are critical moments when the price moves beyond a well-defined level of resistance or support. Volume plays a decisive role in confirming whether these breakouts are genuine or false signals.
Characteristics of a Strong Breakout
Green Candle Confirmation: When you see a strong green candle during a breakout, it signals that buyers are in control.
Massive Volume: The breakout should be accompanied by a significant increase in volume compared to previous candles. This ensures that the move is supported by a large number of market participants.
Spotting Weak Breakouts
On the other hand, if a breakout candle is similar in size to previous candles and the volume does not increase, this is a warning sign of a fake breakout. For instance, if resistance is tested multiple times and only one candle shows a breakout with a volume spike, it increases the likelihood of a genuine move. However, if the volume remains flat, the breakout might not be strong enough to sustain the trend.
When entering a trade on a breakout, always check that the volume bar is significantly taller than previous bars. This is your confirmation that the breakout is valid.
Using volume analysis for breakouts can significantly improve your trading strategy, ensuring that you only take trades that have strong confirmation from market participation.
Volume and Support/Resistance
One of the most robust trading strategies is to combine volume analysis with support and resistance. While support and resistance levels help define where price may reverse or accelerate, volume provides the confirmation needed to validate these levels.
How to Integrate the Two
Confirming Breakouts: When price breaks above a resistance level on high volume, the move is more likely to continue. Similarly, a breakdown below a support level with high volume reinforces the bearish sentiment.
Testing Levels: When the price revisits key support or resistance areas, volume can help you decide if the level will hold or break. A low-volume retest may indicate that the level will hold, while a high-volume retest could signal a breakout or breakdown.
Practical Trading Example
Consider a scenario where the price of a stock or forex pair repeatedly tests a resistance level. During one test, the price manages to break through with a surge in volume, confirming that many traders are buying into the move. This combination of technical analysis tools—the support/resistance level and volume—can help you time your entries and exits more precisely.
Volume Trading FAQ
FAQ
What is volume in trading?
Volume is the number of assets (stocks, forex pairs, or crypto) traded in a period, showing market activity and trend strength.
How does volume confirm trends?
In uptrends, rising volume on price spikes signals strong buying; in downtrends, it shows selling pressure—key for trend analysis.
What’s a volume divergence?
A divergence occurs when price rises but volume falls (bearish) or price drops but volume rises (bullish), hinting at reversals.
How do I use volume for breakouts?
Look for a tall volume bar on a breakout candle—high volume confirms a genuine move past support or resistance.
Can volume improve support/resistance analysis?
Yes, high volume at these levels confirms breakouts or rejections, refining your trading strategy on platforms like TradingView.
Test Your Volume Trading Knowledge! (Interactive Quiz)
Quiz
InvestingPro - AI & Smart Money Trading
(Limited Time: Save 70% Today!)
Unlock cutting-edge trading strategies with InvestingPro.
TradingView - $15 Bonus & 30 Days Free
Access advanced charting tools and premium features.
Bybit Crypto - Up to $30,000 Bonus
Join Bybit for high-leverage crypto trading opportunities.
Conclusion
Volume is an indispensable element of technical analysis that, when used correctly, can enhance every facet of your trading strategy. In this guide, we covered the basics of volume, explained how volume indicators work, and demonstrated how to use volume for trend analysis, spotting reversals, identifying divergences, and confirming breakouts. We also discussed the importance of combining volume analysis with support and resistance to solidify your trading decisions.
By integrating volume trading strategies into your technical analysis, you gain a more nuanced understanding of market dynamics. Whether you are day trading, swing trading, or even trading forex, keeping an eye on volume can help you determine the strength of trends and validate key turning points in the market. Remember, the goal is not to provide explicit financial advice but to empower you with the knowledge needed to make informed decisions.
By following these guidelines, you can boost your trading performance and develop a robust volume analysis strategy that is SEO-friendly and packed with actionable insights. This comprehensive guide is designed to be informative, engaging, and directly aligned with the needs of traders looking to master volume analysis in tradingview, forex, stocks, and beyond.
Final Thoughts
In the ever-changing world of financial markets, understanding volume is critical to improving your technical analysis and overall trading performance. Make sure you review your charts regularly, annotate key volume spikes, and practice integrating volume data with other technical indicators. With diligence and practice, you’ll be well-equipped to identify trends, spot reversals, and confirm breakouts with greater precision.
By incorporating this volume trading strategy into your daily routine, you’re not just trading on price movements—you’re trading on the underlying market psychology reflected by volume. Embrace these techniques and start your journey toward a more informed and confident trading strategy.
Happy trading, and may your volume analysis always lead you to the next successful trade!
Explore More on Mind Math Money
BOS & ChOCH Strategy
Explore Break of Structure and Change of Character for smarter trading moves.
Swing Highs & Lows
Master trading swing points to catch key market reversals.
Liquidity Grab Tactics
Learn how liquidity grabs can refine your trading edge.
Top-Down Analysis
Boost your trades with a big-picture market view.
InvestingPro - AI & Smart Money Trading
(Limited Time: Save 70% Today!)
Unlock cutting-edge trading strategies with InvestingPro.
TradingView - $15 Bonus & 30 Days Free
Access advanced charting tools and premium features.
Bybit Crypto - Up to $30,000 Bonus
Join Bybit for high-leverage crypto trading opportunities.