
What is Technical Analysis? A Beginner’s Guide (2025)
Table of Contents
- Introduction
- What Is Technical Analysis?
- Tools of Technical Analysis
- Charts
- Indicators
- Patterns
- Purpose and Benefits of Technical Analysis
- Identifying Trading Opportunities
- Managing Risk
- Technical Analysis Across Different Markets
- FAQ: Technical Analysis Basics
- Quiz: Test Your Technical Analysis Knowledge
- Conclusion
Key Takeaways
- Definition & Purpose: Technical analysis involves studying past price movements, volume, and chart patterns to forecast future price trends.
- Essential Tools: Charts, indicators (such as RSI, MACD), and pattern recognition are core components used to identify trading opportunities.
- Risk Management: By pinpointing key support and resistance levels, technical analysis helps traders manage risk and set stop-loss orders.
- Market Versatility: Whether in stocks, forex, or crypto, technical analysis provides a systematic framework for making informed trading decisions.
- Strategy Building: The goal is not to win every trade but to develop a strategy with a positive expected value over time.
Introduction
Technical analysis is one of the main trading strategies used by traders all around the world. This guide will simplify and explain technical analysis by breaking down how past price movements can help forecast future price action. We will cover the basics, such as what is technical analysis in the stock market, what is technical analysis in trading, and even look into what is technical analysis in crypto trading. By the end of this article, you'll have a clear understanding of the important concepts and practical applications of technical analysis in 2025 and beyond.
What Is Technical Analysis?
At its core, technical analysis involves studying past price movements and trading volumes to predict future price action. As the adage goes, "history doesn't repeat itself, but it often rhymes." This means that while exact conditions may not reoccur, the patterns seen in historical data tend to reappear, offering traders clues about potential future trends.
Technical analysis is not about winning every trade. Instead, it focuses on achieving a positive expected value over many trades. By identifying key buy and sell opportunities, technical analysts aim to build a strategy that, over time, results in overall profitability. This approach is widely applicable across various markets, including stocks, forex, and cryptocurrencies.
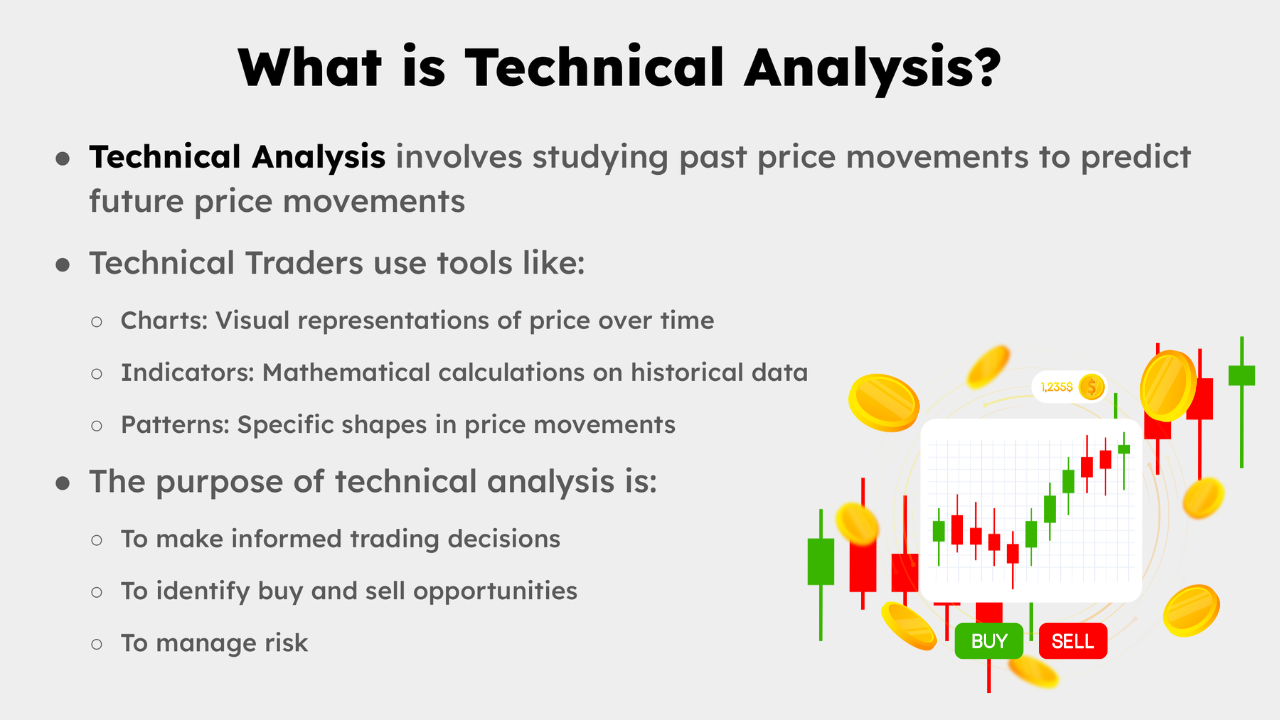
What is Technical Analysis? Technical Analysis, or for short TA, involves studying past price movements to predict future price movements. Technical traders use tools like charts, indicators and patterns with the purpose of making informed trading decisions and identifying buy and sell opportunities.
Tools of Technical Analysis
Discover the essential tools that empower traders to interpret market behavior and make informed decisions. Click on each section below to explore more about how these tools enhance your trading strategy!
Charts
Charts are the visual heartbeat of market data, transforming raw numbers into clear, actionable trends. They allow you to spot key price movements, recognize support and resistance levels, and visualize overall market sentiment—all crucial for timely trading decisions.
Indicators
Indicators turn historical price data into meaningful signals. Tools like moving averages and the Relative Strength Index (RSI) help confirm trends and forecast potential reversals, providing that extra layer of insight necessary to fine-tune your entry and exit points.
Patterns
Patterns reveal recurring formations in price charts, such as head and shoulders or double tops. Recognizing these patterns can guide you in predicting future market movements, allowing you to capture opportunities before they fully unfold.
Charts
Charts are the visual backbone of technical analysis. They provide a graphical representation of price movements over time, enabling traders to quickly spot trends, support and resistance levels, and potential reversal points.
Charts are essential for understanding what is technical analysis in trading and are equally useful in the context of the stock market, forex, and crypto trading.
Indicators
Indicators are mathematical calculations based on historical price and volume data. They serve as additional layers of insight, helping traders confirm trends or signal potential reversals. Common indicators include moving averages, the Relative Strength Index (RSI), and MACD (Moving Average Convergence Divergence).
Using indicators can help answer questions like what is technical analysis explained and make it easier for beginners to navigate the complex world of trading.
Patterns
Chart patterns are specific formations that appear on price charts. Patterns such as head and shoulders, triangles, and double tops/bottoms are interpreted as signals for future price movement. Recognizing these patterns can be crucial for anyone wondering what is technical analysis for beginners or looking for an explanation that makes technical analysis easy to understand.
Purpose and Benefits of Technical Analysis
Technical analysis provides traders with a systematic approach to identifying profitable trades and managing risk. The following sub-sections explain the primary purposes and benefits of using technical analysis.
Identifying Trading Opportunities
One of the primary reasons traders use technical analysis is to pinpoint trading opportunities. By analyzing historical price data, traders can determine when a particular asset is poised to move in a favorable direction. This method applies across markets—from stocks and forex to cryptocurrencies. Instead of aiming for perfection in every trade, technical analysis helps build a strategy where the overall trading portfolio benefits from a positive expected value over many trades.
Key phrases such as what is technical analysis in stock market and what is technical analysis in crypto can be naturally integrated into your strategy by focusing on trend analysis, breakout signals, and trend reversals.
Managing Risk
Another crucial aspect of technical analysis is risk management. Even the most well-planned trade can go awry, so it’s essential to have safeguards in place. Traders set stop-loss orders to protect themselves against significant losses. This risk management technique ensures that while pursuing high-probability trades, the downside is also controlled.
A practical example in HTML to display risk management tips on your blog might look like this:
Risk Management Tips
- Always set a stop-loss before entering a trade.
- Determine your risk/reward ratio.
- Diversify your trades to spread risk.
- Regularly review and adjust your trading plan.
This section answers the question what is technical analysis in forex trading by demonstrating how risk management is universally applied.
Technical Analysis Across Different Markets
The beauty of technical analysis lies in its versatility. While the core principles remain the same, its application can vary across different trading environments:
Stock Market: Technical analysis of stocks often focuses on price trends, volume spikes, and chart patterns to determine entry and exit points. Investors use these tools to answer the query what is technical analysis in stock market.
Forex Trading: In forex, technical analysis is key to understanding currency pair movements. Traders analyze historical data to predict shifts in trends, helping them manage risk in volatile markets. This directly addresses what is technical analysis in trading.
Cryptocurrency Trading: With the growing popularity of cryptocurrencies, technical analysis has become vital in navigating their unpredictable markets. Traders look for unique patterns and indicators specific to crypto assets, effectively answering what is technical analysis in crypto trading and what is technical analysis in crypto.
The consistent theme across these markets is that technical analysis provides a systematic approach to decision-making that is not about guaranteeing a win on every trade, but about building a robust trading strategy over time.
Technical Analysis FAQ: TA Basics
FAQ: Technical Analysis Basics
A: Technical analysis is the study of past market data—primarily price and volume—to forecast future price movements and identify trading opportunities.
A: The primary tools include charts, various technical indicators (like RSI, MACD, moving averages), and pattern recognition techniques.
A: It helps traders identify key support and resistance levels, set stop-loss orders, and determine risk/reward ratios, thereby managing downside risk effectively.
A: Yes, technical analysis is versatile and can be applied to stocks, forex, cryptocurrencies, and other markets since it relies on historical price data and market behavior patterns.
A: No, it is not a guarantee. It is a tool that helps traders make informed decisions and manage risk, but no method can predict market movements with 100% certainty.
Technical Analysis Quiz: Test Your Skills
Quiz: Test Your Technical Analysis Knowledge
Conclusion
In summary, technical analysis is a powerful tool that helps traders across various markets—whether you're focused on stocks, forex, or cryptocurrencies—make more informed decisions. By studying past price movements through charts, indicators, and patterns, traders can identify promising opportunities and manage risk effectively.
Understanding what is technical analysis and its applications in different trading environments lays the foundation for successful trading strategies. Remember, the goal is not to win every trade but to achieve a positive expected value over many trades through careful analysis and risk management.
We hope this comprehensive guide has clarified the concept of technical analysis and provided you with actionable insights to refine your trading strategy. For more in-depth training and tips, stay tuned for our upcoming courses and articles.
Read More on Mind Math Money
The RSI Indicator: A Deep Dive
Learn how to effectively use the Relative Strength Index to gauge market momentum and identify overbought or oversold conditions.
Read MoreUnderstanding Break of Structure & CHOCH
Discover the significance of market structure shifts and how change of character can signal key trading opportunities.
Read MoreMastering Fibonacci Retracement
Explore the art of drawing Fibonacci retracement levels in TradingView to uncover potential price reversals and trade setups.
Read MoreWhat is Price Action Trading?
Dive into the fundamentals of price action trading and learn how to read market behavior without relying solely on indicators.
Read More