
The RSI Indicator: How to Use Relative Strength Index Like a Pro
Master the Relative Strength Index to identify reversal points, divergences, and optimal entry/exit opportunities.
Last Updated: March 7, 2025
Overbought conditions indicate a price increase that's faster than normal, suggesting potential for a reversal or consolidation
Oversold conditions signal a price drop that's sharper than normal, potentially setting up for a rebound as selling pressure eases
The RSI indicator measures momentum with readings above 70 indicating overbought conditions and below 30 indicating oversold conditions
Always seek confirmation through other analysis methods before trading overbought/oversold signals
Bollinger Bands and the Stochastic Oscillator are effective alternatives to the RSI for identifying overbought and oversold conditions
Whether we are talking about crypto, stocks, forex, or any other market, two terms frequently come up: overbought and oversold. These conditions are important to understand and are often identified using various trading indicators, with the RSI Indicator (Relative Strength Index), being one of the most popular. This article will explain these terms and show you how to identify overbought and oversold conditions using the RSI indicator, making your trading game more strategic and informed.
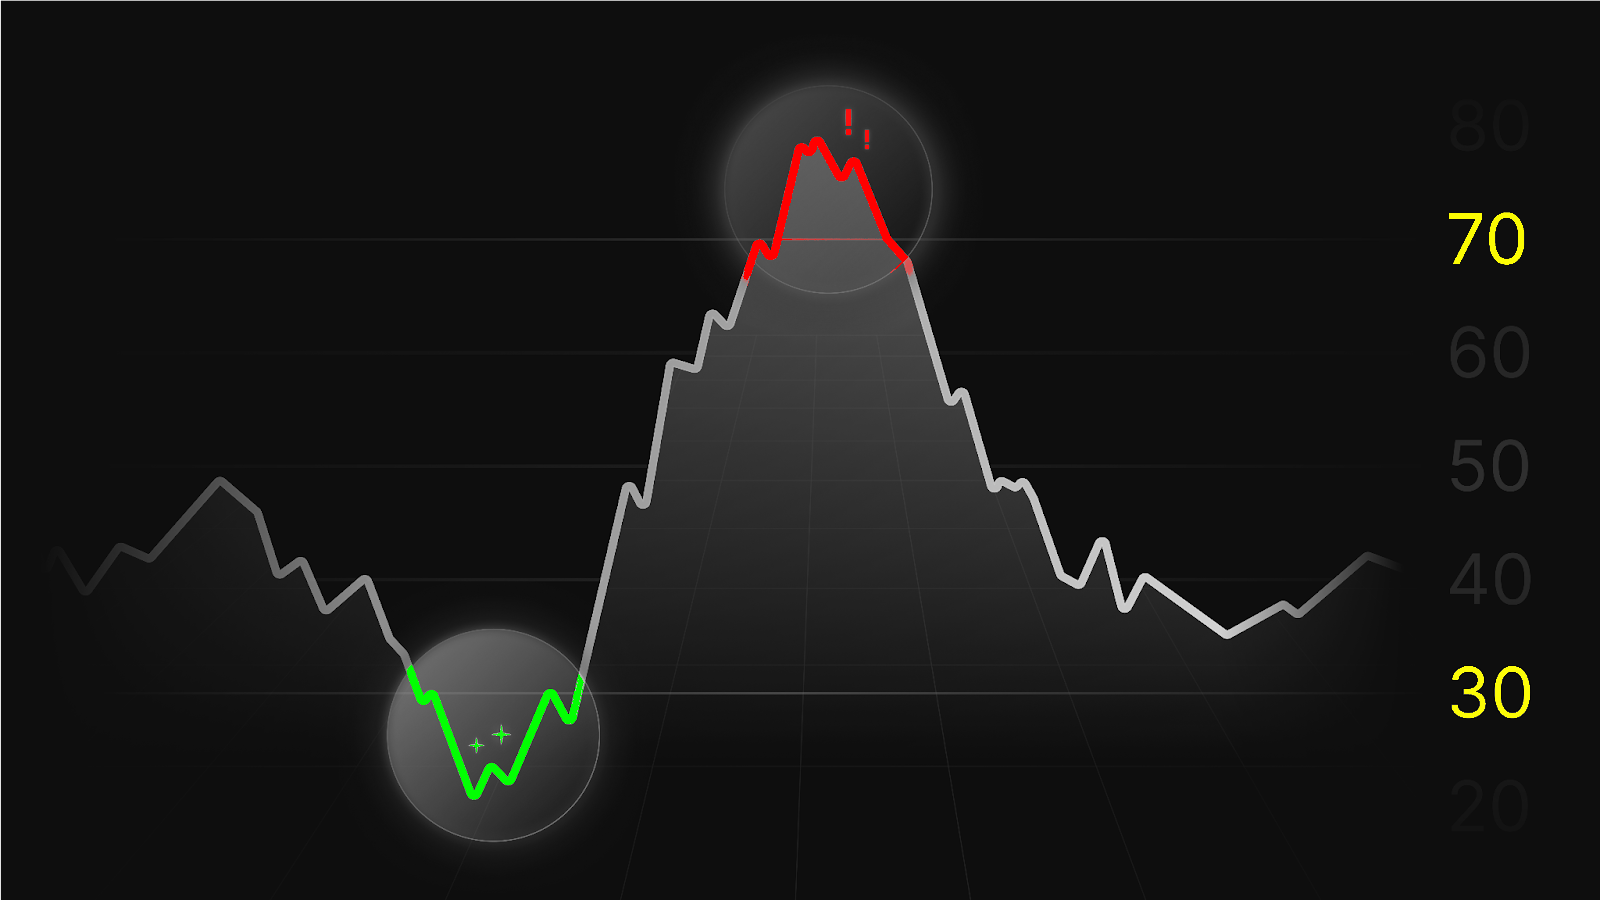
An asset, like a stock, crypto, or forex pair is considered overbought when it’s above 70 and oversold when it’s below 30.
Before diving into the technicalities of the RSI indicator, let's first break down what overbought and oversold conditions really mean and why they are critical for traders.
Technically, an overbought condition implies that the price of an asset has risen more aggressively over a short period than its historical average, indicating a strong buying pressure. This condition can suggest that the asset is overvalued in the short term, as the price increase is abnormal. When an asset is overbought it could indicate that the price has moved too far, too fast, and might be due for a correction as the buying momentum wanes.
On the flip side, an oversold condition indicates that the price of an asset has fallen more sharply over a short period than its historical average, signaling strong selling pressure. This condition can suggest that the asset is undervalued in the short term, as the price decrease is sharper than the norm. When an asset is oversold, it could indicate that the price has dropped too far, too quickly, and might be due for a rebound as the selling momentum subsides.
The Relative Strength Index (RSI), a momentum indicator, quantifies these conditions by measuring the speed and change of price movements. It does this by comparing the average gains and losses over a specified period, typically 14 periods (like days or hours), to determine whether an asset is in overbought or oversold territory.
RSI Above 70: Indicates overbought conditions, suggesting the asset's price has increased too rapidly and might soon reverse or consolidate.

RSI Overbought
RSI Below 30: Points to oversold conditions, implying the asset's price has fallen too quickly and could be in for a rebound.
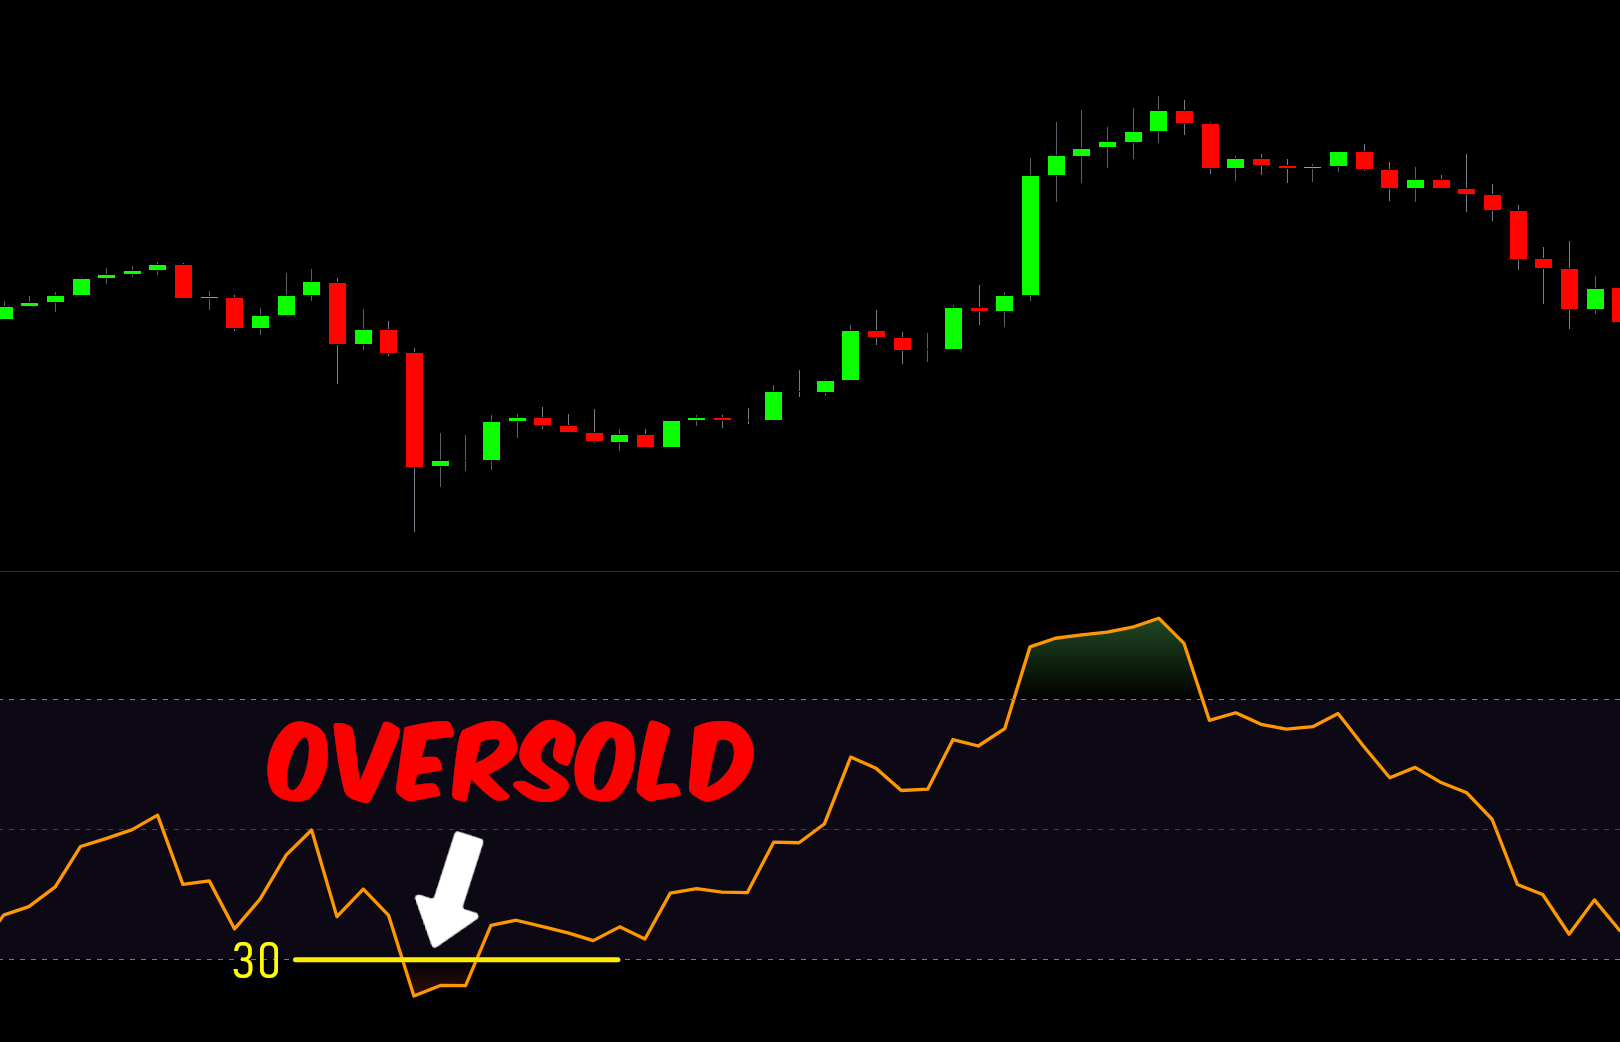
RSI Oversold
Look for Confirmation: Before acting on overbought or oversold signals, seek confirmation through other analysis methods. This can include technical patterns, trend analysis, or volume indicators, which can provide additional evidence of a pending reversal.
Consider the Trend: The market trend should influence how you interpret overbought and oversold conditions. In a strong uptrend, assets can remain overbought for an extended period, and similarly, in a downtrend, assets can stay oversold. Thus, aligning your trading decisions with the overall market trend can improve the likelihood of success in trading overbought and oversold states.
Risk Management: Especially in volatile markets, overbought and oversold signals can precede significant price movements. Implementing strict risk management rules, such as setting a stop-loss, can help protect your investments from big losses.
While the RSI is a popular tool for spotting overbought and oversold levels, several other indicators and techniques can offer valuable insights:
Bollinger Bands: These bands expand and contract based on market volatility and can indicate overbought or oversold conditions when prices move beyond the upper or lower bands.
Stochastic Oscillator: Similar to the RSI, this momentum indicator compares a particular closing price of an asset to a range of its prices over a specific period. Overbought and oversold conditions are identified through the oscillator's value relative to its range.
Before using RSI for overbought/oversold conditions, determine the overall market trend using a longer-term chart. In an uptrend, focus on oversold conditions for potential buying opportunities. In a downtrend, prioritize overbought conditions for potential selling opportunities.
Set up the RSI indicator with a 14-period timeframe (standard setting). Draw horizontal lines at the 70 (overbought) and 30 (oversold) levels. For more conservative entries, you can use 80/20 levels instead.
In an uptrend: Wait for RSI to drop below 30 (oversold) and then begin moving back above 30.
In a downtrend: Wait for RSI to rise above 70 (overbought) and then begin moving back below 70.
Look for candlestick patterns that confirm a potential reversal. For example, in an uptrend with an oversold RSI signal, look for bullish patterns like hammer candles, engulfing patterns, or dojis near support levels.
Enter the trade when RSI crosses back above 30 (in uptrend) or below 70 (in downtrend) AND price action confirms.
Place stop loss just beyond the recent swing low/high.
Set take profit at the next resistance level or previous swing high for long trades, or at the next support or previous swing low for short trades.
Risk Management Warning: Never risk more than 1-2% of your trading capital on any single trade. RSI signals work best in conjunction with other technical indicators and proper risk management techniques.
When a market is overbought, it means the price has risen more aggressively over a short period than its historical average. This indicates strong buying pressure and suggests the asset may be overvalued in the short term. Overbought conditions often signal that a price reversal or consolidation may be imminent as buying momentum begins to wane.
When a market is oversold, it means the price has fallen more sharply over a short period than its historical average. This indicates strong selling pressure and suggests the asset may be undervalued in the short term. Oversold conditions often signal that a price rebound may occur as selling momentum subsides and buyers see value at lower prices.
The Relative Strength Index (RSI) is calculated by comparing the average gains and losses over a specified period, typically 14 periods. The formula is: RSI = 100 - [100 / (1 + RS)], where RS is the average of x periods' gains divided by the average of x periods' losses. The resulting value ranges from 0 to 100, with readings above 70 indicating overbought conditions and below 30 indicating oversold conditions.
While overbought and oversold indicators like RSI can signal potential price reversals, they should not be used in isolation. These indicators work best when combined with other technical analysis tools and confirmation signals. In strong trends, markets can remain overbought or oversold for extended periods without reversing. Therefore, these indicators are most effective when used as part of a comprehensive trading strategy that includes trend analysis, support/resistance levels, and proper risk management.
The optimal timeframe depends on your trading style and goals. Short-term traders might focus on 1-hour, 4-hour, or daily charts, while swing traders might prefer daily or weekly charts. For more reliable signals, consider using multiple timeframes - for example, confirm a daily chart signal with the weekly chart to ensure alignment with the longer-term trend. Remember that shorter timeframes produce more frequent but less reliable signals, while longer timeframes generate fewer but often more significant signals.
The concepts of overbought and oversold are central to trading across various markets, offering important insights into potential market reversals and the emotional state of market participants. By understanding these conditions and integrating them into a comprehensive trading strategy, traders can better navigate the complexities of the market. Remember, successful trading involves a blend of technical analysis, market sentiment analysis, and robust risk management to make informed decisions and manage potential risks effectively. To learn more about trading, don’t hesitate to check more of my educational guides.
Master the Relative Strength Index to identify reversal points, divergences, and optimal entry/exit opportunities.
Learn how to identify and trade RSI divergences across different markets for higher probability setups.
Discover how to use Bollinger Bands to identify periods of low volatility before explosive price movements.
A complete framework for using RSI from basic to advanced techniques for successful trading.
(Limited Time: Save 70% Today!)
Unlock cutting-edge trading strategies with InvestingPro.
Access advanced charting tools and premium features.
Join Bybit for high-leverage crypto trading opportunities.
I bought my first stock at 16, and since then, financial markets have fascinated me. Understanding how human behavior shapes market structure and price action is both intellectually and financially rewarding.
I’ve always loved teaching—helping people have their “aha moments” is an amazing feeling. That’s why I created Mind Math Money to share insights on trading, technical analysis, and finance.
Over the years, I’ve built a community of over 200,000 YouTube followers, all striving to become better traders. Check out my YouTube channel for more insights and tutorials.