
RSI Divergence Trading Strategy: Forex, Crypto and Stock Trading
Take your RSI trading to the next level with advanced divergence strategies across multiple markets.
Last Updated: March 7, 2025
The RSI (Relative Strength Index) measures price momentum on a scale of 0-100, with traditional overbought levels above 70 and oversold below 30
Avoid the common mistake of simply buying on oversold conditions (RSI below 30) and selling on overbought conditions (RSI above 70), especially in strong trends
RSI divergence is a powerful signal - bullish divergence occurs when price makes lower lows while RSI makes higher lows, suggesting potential upward reversal
Combining RSI with chart patterns like double bottoms can significantly improve trading success by confirming potential reversals
Optimize your RSI settings by including OHLC (Open, High, Low, Close) data rather than just closing prices for a more comprehensive view of market conditions
Do you prefer watching over reading? Check out this RSI Indicator YouTube video, where we break down all the key concepts covered in this article. You'll see real-world chart examples of RSI divergence, double bottom patterns with RSI, and the optimal settings professional traders use.
(Limited Time: Save 70% Today!)
Unlock cutting-edge trading strategies with InvestingPro.
Access advanced charting tools and premium features.
Join Bybit for high-leverage crypto trading opportunities.
The RSI Indicator, or in other words, the Relative Strength Index, is widely known in the trading community for its potential to provide insights into market momentum and prediction of possible price reversals. Yet, its true power lies in the trader’s ability to apply it correctly. Misinterpretations of its signals can lead to worse trading outcomes and should be avoided at all costs. The goal of this short article is to clarify common misconceptions, introduce optimal RSI settings, share strategies employed by professional traders, and offer practical tips for utilizing the RSI indicator effectively.
The foundation of effectively using the RSI lies in understanding what the indicator represents. Oscillating between 0 and 100, the RSI measures the velocity of price movements. Traditionally, values above 70 indicate overbought conditions, while values below 30 suggest oversold conditions. However, the RSI indicator should not be taken at face value and the traditional overbought/oversold interpretation is a bit too simplistic.
A widespread misunderstanding among traders is the inclination to buy in perceived oversold conditions (RSI below 30) and sell in what are deemed overbought conditions (RSI above 70). This approach overlooks the importance of understanding momentum and can lead to unproductive trades, particularly in strongly trending markets where the RSI may remain in these extreme zones for a prolonged period. Two more productive use cases are to use it to trade RSI divergence and to combine that RSI with chart patterns such as the double bottom pattern. It’s also often combined with other trading indicators such as the MACD indicator or moving averages.
Professional traders may use divergence as an indicator of potential price reversals. Divergence occurs when the direction of the RSI and price action diverge. For example, a bullish divergence, characterized by lower lows in price and higher lows in the RSI, may indicate an upcoming uptrend. On the other hand, bearish divergence is observed when higher highs in price accompany lower highs in the RSI, potentially signaling a downtrend.
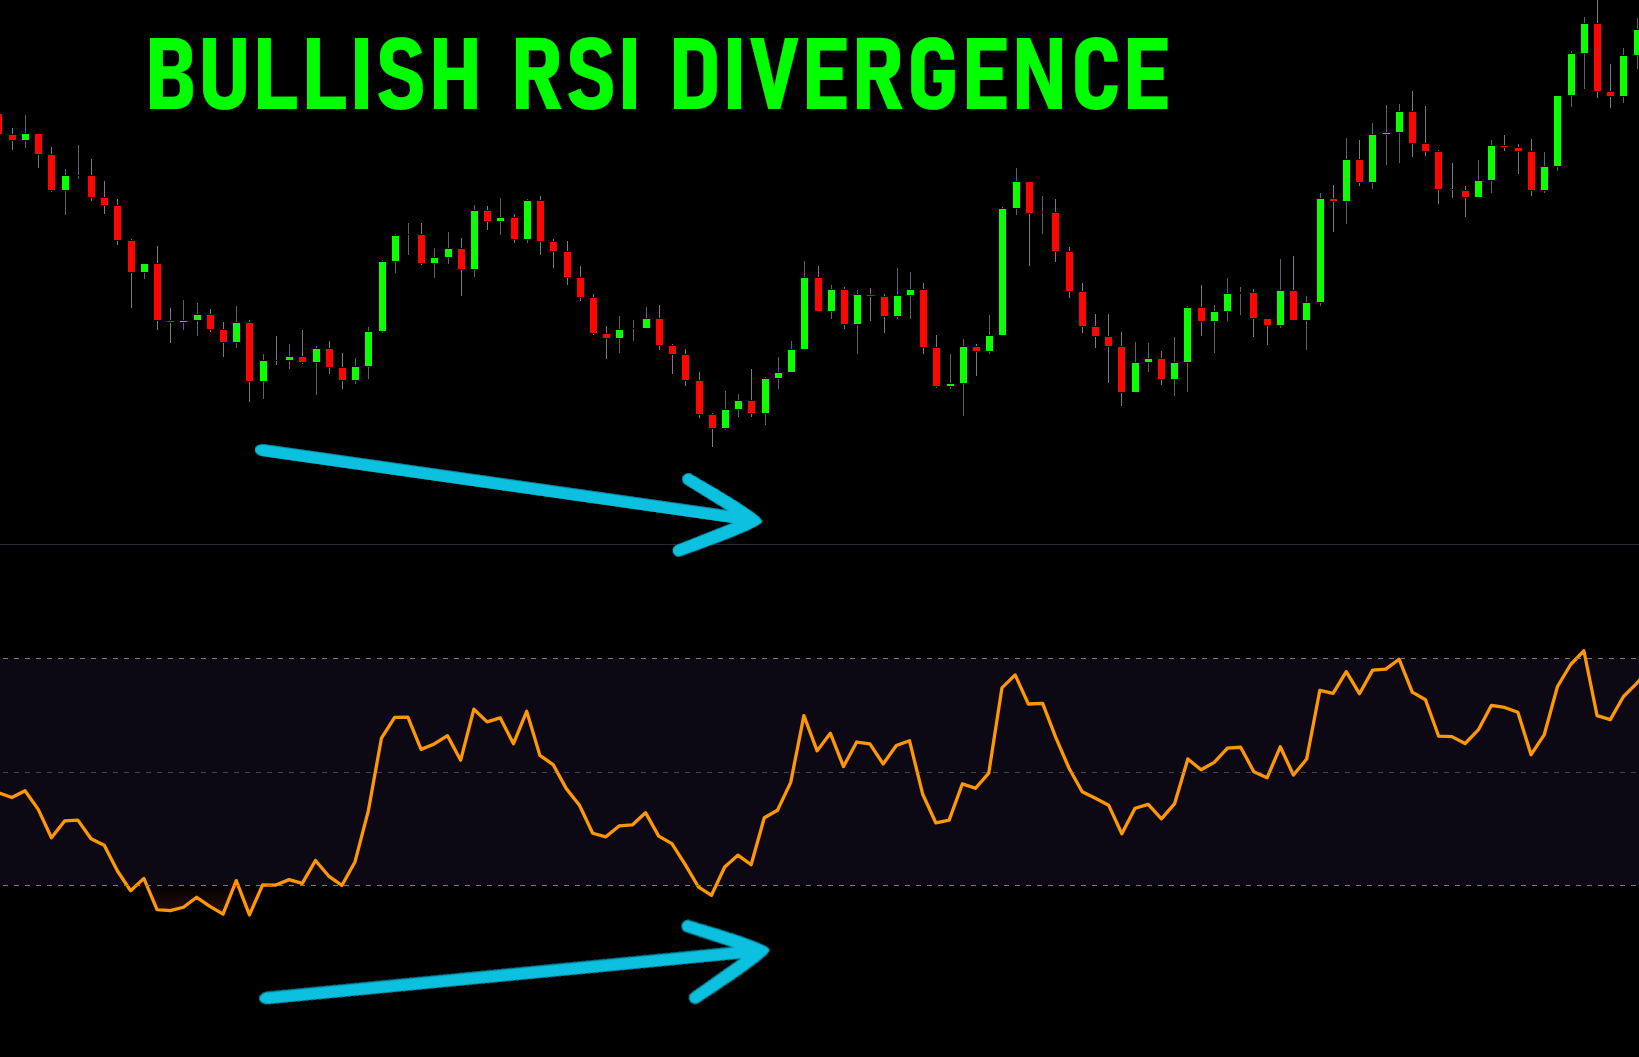
Bullish RSI Divergence
In applying divergence strategies, traders often seek additional confirmation through chart patterns, support and resistance levels, or candlestick formations to enhance the probability of a successful trade.
The double bottom pattern, visually forming a "W" on the chart, is a classic signal of a potential upward reversal. When this pattern coincides with a rising RSI—despite the price making two lows—it may suggest increasing bullish momentum. Traders might consider entering a trade after the price breaks above the resistance level that forms the middle of the "W".

Double Bottom Pattern and RSI
By default, the RSI is calculated based on the closing prices of candles. Adjusting the RSI to include the open, high, low, and close (OHLC) of candles can provide a smoother index that may offer a more accurate reflection of market conditions. This setting can help diminish market "noise" and clarify trend directions.
For those utilizing TradingView, employing a divergence indicator can automate the identification of potential divergences. While beneficial, it's essential to recognize its limitations and not rely on it exclusively for trading decisions. A combination of manual analysis and automated tools can form a more robust trading approach.
Overemphasis on Extreme Levels: Traders may find that basing decisions solely on the RSI crossing over 70 or below 30 can lead to misleading signals. It's crucial to consider the broader market context.
Ignoring the Overall Trend: In strong trends, the RSI might remain in overbought or oversold zones longer than anticipated. Observing the general market trend alongside RSI indicators can provide more nuanced insights.
Overlooking Divergence: The occurrence of divergence between the RSI and price action offers valuable signals that are often underestimated by traders.
RSI stands for Relative Strength Index. It's a momentum oscillator that measures the speed and change of price movements on a scale from 0 to 100. It compares the magnitude of recent gains to recent losses to determine overbought and oversold conditions of an asset.
The traditional RSI setting is 14 periods, with 70 and 30 as overbought and oversold levels. However, many professional traders customize these settings based on the market and their trading style. For more volatile assets, you might use a higher period setting (21 or 25) to reduce noise. For more responsive signals, a lower period (7 or 9) might be preferred. Additionally, including OHLC (Open, High, Low, Close) data rather than just closing prices can provide a more comprehensive view of market conditions.
RSI divergence occurs when the price movement of an asset and the RSI indicator move in opposite directions, suggesting a potential reversal. To identify bullish divergence, look for when price makes lower lows while the RSI makes higher lows. For bearish divergence, look for price making higher highs while RSI makes lower highs. These patterns often indicate weakening momentum and an upcoming reversal in the current trend.
No, this is a common misconception. While RSI below 30 traditionally indicates oversold conditions and above 70 indicates overbought conditions, these signals shouldn't be used in isolation. In strong trends, RSI can remain in overbought or oversold territory for extended periods. It's better to use RSI in conjunction with other indicators and price action analysis. For example, look for RSI divergence or wait for RSI to move back above 30 (for oversold) or below 70 (for overbought) before taking a position.
RSI works well when combined with other technical analysis tools. Some effective combinations include: 1) RSI with trend lines or moving averages to confirm the overall trend direction; 2) RSI with chart patterns like double bottoms or head and shoulders; 3) RSI with support and resistance levels; 4) RSI with MACD for confirmation of momentum shifts; and 5) RSI with volume indicators to verify the strength of price movements. When multiple indicators align to give the same signal, the trade setup typically has a higher probability of success.
The RSI offers more than a simplistic view of market conditions; it provides a nuanced tool that, when applied correctly, can improve trading strategies and decisions. Understanding its underlying principles, avoiding common errors, and using concepts like divergence and pattern recognition can empower traders with enhanced decision-making. It's important to remember that no single indicator should dictate your trading actions. Employing a comprehensive approach, integrating various technical analysis tools, and adhering to sound risk management principles are key to fostering trading proficiency.
Take your RSI trading to the next level with advanced divergence strategies across multiple markets.
Learn how to effectively use the MACD indicator alongside RSI for powerful confirmation signals.
Dive deeper into advanced RSI techniques with our comprehensive 2025 guide.
Learn how to combine RSI signals with volume analysis for high-probability trading setups.
(Limited Time: Save 70% Today!)
Unlock cutting-edge trading strategies with InvestingPro.
Access advanced charting tools and premium features.
Join Bybit for high-leverage crypto trading opportunities.
I bought my first stock at 16, and since then, financial markets have fascinated me. Understanding how human behavior shapes market structure and price action is both intellectually and financially rewarding.
I’ve always loved teaching—helping people have their “aha moments” is an amazing feeling. That’s why I created Mind Math Money to share insights on trading, technical analysis, and finance.
Over the years, I’ve built a community of over 200,000 YouTube followers, all striving to become better traders. Check out my YouTube channel for more insights and tutorials.