
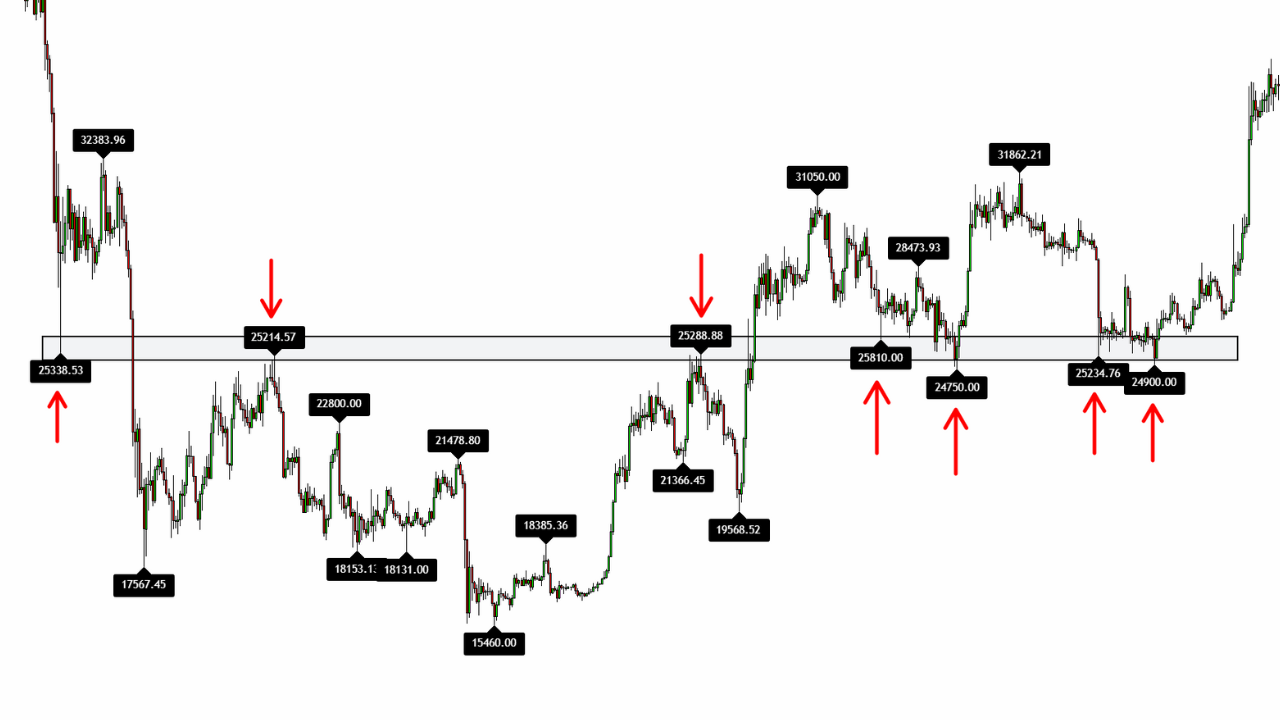
Support and Resistance TradingView Indicator: The Pivot Point Trading Strategy
The Pivot Points High and Low Indicator is one of the most effective tools on TradingView for identifying key support and resistance levels. In this article, you'll learn how to set it up and use it step-by-step to potentially improve your trading strategy.

The RSI Indicator: How to use the RSI Indicator (Relative Strength Index) for Trading Crypto, Forex, and Stocks.
In this article, you'll learn everything about the RSI Indicator (Relative Strength Index) — what it is, how it relates to momentum, RSI divergences, and much more!
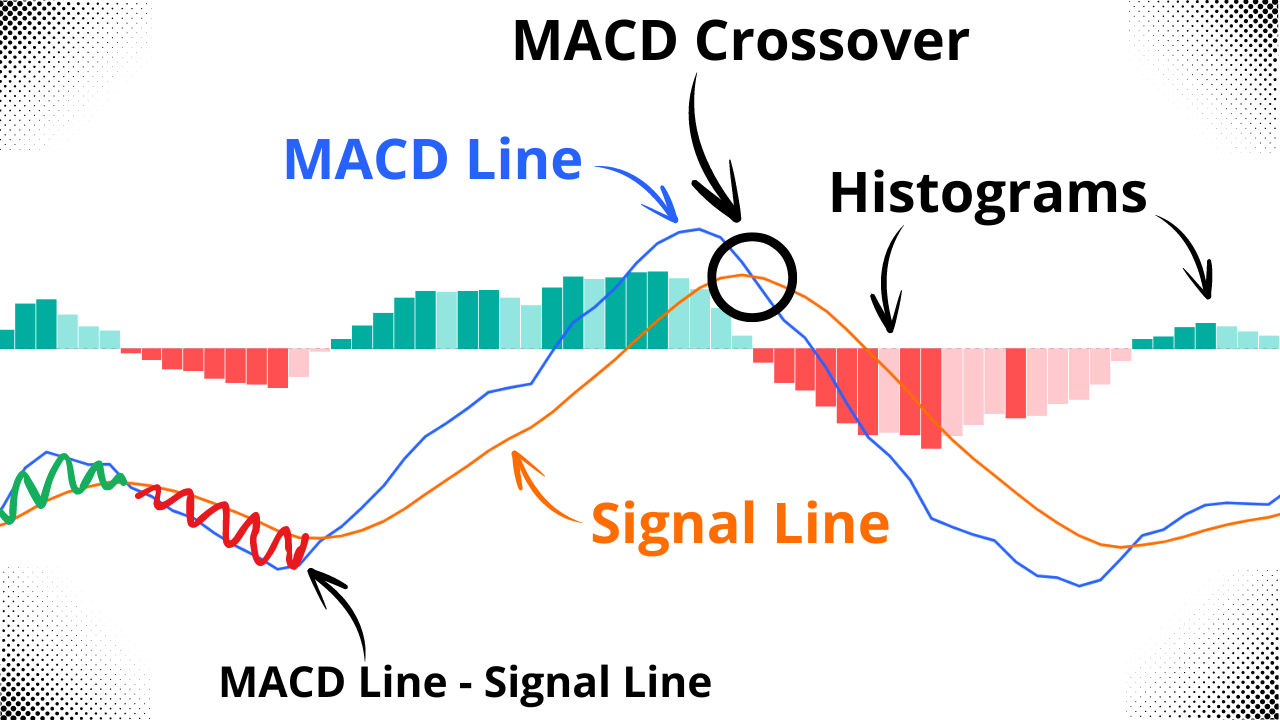
Understanding the MACD Indicator: MACD Line, Signal Line, Histogram, Crossover and Zero Line
What is MACD? If you've been trading for a while, you've likely come across the MACD indicator. While it might seem complex at first glance, the MACD is actually straightforward and highly effective. In this article, you'll learn how the MACD indicator works, and its key components: the MACD line, signal line, histogram, and zero line.

How to Draw Fibonacci Extensions: Fibonacci Extension Levels, Targets, and Trading Strategy
In this Fibonacci Extension trading guide, we delve into how to identify key target levels using Fibonacci extensions. Learn to pinpoint precise entry and exit points by recognizing swing highs and lows, and discover the significance of critical levels like 0.786, 1.0, and 1.618.

Understanding the Simple Moving Average (SMA) Trading: A Quick Guide
The Simple Moving Average (SMA) is fundamental for identifying trends and market conditions, but there's no magic SMA period that works for all situations. This guide debunks common SMA myths, shows you how to calculate and interpret SMAs correctly, and explains how to incorporate them into a comprehensive trading strategy for stocks, forex, and crypto markets.

Overbought and Oversold in Trading: A Simple Guide to Momentum Trading (2025)
Discover the crucial concepts of overbought and oversold conditions that can transform your trading decisions. This beginner-friendly guide explains not just what these terms mean, but shows you how to identify these high-probability trading opportunities using the powerful RSI indicator. Learn when prices have moved too far, too fast, and how to potentially profit from the inevitable corrections.