
The Doji Candlestick Pattern: Dragonfly, Gravestone, Long-Legged and Four Price Doji
Dive deeper into the powerful Doji family of candlestick patterns and learn how to trade these key indecision signals.
Prefer video? Watch the full candlestick pattern trading course on YouTube! The video covers everything in this article plus visual demonstrations of each pattern in real market conditions. You'll see exactly how professional traders identify and execute trades using these powerful formations.
Candlestick patterns reveal market psychology through their unique components (body and wicks), with the relationship between these elements indicating bullish or bearish strength.
Context matters tremendously in pattern trading – the same candlestick formation can have completely different implications depending on where it appears in relation to trends and support/resistance levels.
Reversal patterns (like Engulfing patterns, Hammers, and Morning/Evening Stars) signal potential trend changes and work best when they appear after extended moves or at key support/resistance zones.
Continuation patterns (like Flags and Three Methods) allow traders to enter established trends during brief pauses, often providing favorable risk-reward opportunities by trading in the direction of the prevailing trend.
Effective candlestick trading requires disciplined risk management – using pattern structures for stop-loss placement, maintaining favorable risk-reward ratios (minimum 1:2), and combining patterns with other technical tools for confirmation.
This comprehensive guide explores everything you need to know about candlestick patterns for trading stocks, forex, crypto, or any other financial market. Learn how to identify and trade the most effective candlestick patterns like a professional trader, gaining the edge to profit in both bull and bear markets.
Disclaimer: This content is for educational purposes only and does not constitute financial advice. Trading involves risk of loss. Past performance is not indicative of future results.
If you've ever looked at a trading chart and felt overwhelmed by all those red and green bars, you're not alone. But what if those seemingly random candles could actually reveal powerful insights about where the market might go next?
That's the beauty of candlestick patterns – they tell visual stories about the battle between buyers and sellers, offering valuable clues about potential market reversals and continuations. As one of the oldest technical analysis tools (dating back to 18th century Japanese rice traders), candlestick patterns have stood the test of time because they simply work.
In this definitive guide, I'll walk you through everything I've learned about trading with candlestick patterns through years of market experience. We'll cover not just how to identify these patterns, but more importantly, how to develop practical trading strategies around them that can potentially improve your results in any market condition.
Before diving into specific patterns, we need to understand the fundamental building blocks that make up every candlestick chart.

This diagram shows the fundamental structure of candlestick charts used by traders worldwide. Red (bearish) candles indicate price decline while green (bullish) candles show price increase. Each candlestick clearly displays the open, close, high and low prices, with the body showing the range between opening and closing prices, and the wicks (shadows) showing the full trading range during the period.
Professional traders rely on TradingView's advanced charting tools to identify high-probability candlestick patterns. The platform offers customizable timeframes, drawing tools for pattern identification, and the ability to save and compare multiple pattern setups.
A candlestick represents price movement during a specific time period (which you select as your "timeframe"). Whether you're looking at a 1-minute chart or a daily chart, each candle communicates four crucial price points:
Open: The price at the beginning of the period
Close: The price at the end of the period
High: The highest price reached during the period
Low: The lowest price reached during the period
When looking at a standard chart, you'll typically see:
Green (or white) candles: Price closed higher than it opened (bullish)
Red (or black) candles: Price closed lower than it opened (bearish)
Each candle also has two main components:
The body: The wide part of the candle showing the range between opening and closing prices
The wicks (or shadows): The thin lines extending above and below the body, showing the highest and lowest prices reached
What many new traders miss is that these simple elements contain a wealth of information about market psychology. For instance, a long green candle with minimal wicks shows strong buying pressure throughout the period, with buyers in firm control.
The true power of candlestick analysis comes from understanding what each candle reveals about market strength. Let me share something that took me years to fully grasp: the relationship between a candle's body and its wicks tells you more about market sentiment than price movement alone.
For example, imagine two candles with identical high and low points, but different body sizes. The candle with the larger body demonstrates stronger conviction in that direction. If it's a bullish candle with a large body, it shows buyers maintained control throughout most of the period – a much stronger signal than a candle where prices fluctuated wildly before closing slightly higher.
I've found through countless trading sessions that longer bodies relative to the overall candle size typically indicate stronger momentum and conviction in that direction. Conversely, candles with small bodies and long wicks (like Dojis, which we'll explore later) suggest indecision and potential reversal points.
The wicks of a candle provide critical insights about rejected price levels. In my trading experience, wick analysis often reveals where smart money (institutional traders) may be positioning themselves.
Consider this practical example: a bearish candle with a very long lower wick tells us that while sellers initially pushed prices down substantially, buyers eventually stepped in with enough force to push prices back up. This "rejection" of lower prices can be a powerful signal, especially at support levels.
I've noticed that many retail traders focus exclusively on candle bodies while overlooking these wick rejections – which is precisely why incorporating wick analysis into your trading can give you an edge.
Momentum analysis is where candlestick reading becomes truly powerful. By comparing a candle to previous candles, we can gauge how sentiment and momentum are shifting in real-time.
A momentum candle is typically defined as a candlestick with a real body at least twice the size of previous candles. In my trading, I've found momentum candles to be particularly significant when they appear after a period of consolidation or at key support/resistance levels.
For example, if you see a strong momentum candle breaking above a resistance level after several small-bodied candles, this often signals the beginning of a new uptrend with significant follow-through potential. I'll show you specific ways to trade these setups later in this guide.
Before we dive into specific patterns, it's crucial to understand how candlestick patterns are classified. This framework will help you categorize any pattern you encounter in the markets.
Every candlestick pattern has three key classifications:
Context is Key: The same candlestick pattern can have completely different implications depending on where it appears in relation to the overall trend and key price levels.
Simple patterns: Consist of just one candlestick (e.g., Hammer, Shooting Star, Doji)
Complex patterns: Comprise two or more candlesticks (e.g., Engulfing patterns, Morning Star, Three Methods)
Bullish patterns: Indicate potential upward price movement
Bearish patterns: Suggest potential downward price movement
Neutral patterns: Signal indecision or potential for movement in either direction
Reversal patterns: Signal that the current trend may be ending and reversing
Continuation patterns: Suggest the current trend may continue after a brief pause
What I've learned from years of pattern trading is that context matters tremendously. The same candlestick appearing at different points in a trend can have completely different implications. For instance, a Doji after an extended uptrend might signal exhaustion and potential reversal, while the same Doji during a consolidation phase might simply indicate indecision.
This is why professional traders don't just memorize patterns – they understand the underlying market psychology that each pattern represents.
Reversal patterns indicate potential trend changes and can provide excellent trading opportunities when identified correctly. Let's examine the most effective reversal patterns and how to trade them.

Bullish Engulfing Pattern
A two-candle reversal pattern where a larger green candle completely engulfs the previous red candle's body. Signals strong buying pressure after a downtrend, indicating buyers have overwhelmed sellers.
The Bullish Engulfing pattern is a powerful two-candle reversal signal that occurs during downtrends.
Identification:
First candle: A red (bearish) candle with a relatively small real body
Second candle: A green (bullish) candle that completely "engulfs" the body of the previous candle
The pattern appears after a downtrend
Trading Strategy:
Entry: Enter when the second (green) candle closes
Stop-Loss: Place slightly below the lowest point of the pattern
Target: Use a 2:1 risk-reward ratio or aim for previous resistance levels
What makes this pattern particularly effective is the complete rejection of the previous bearish sentiment, showing that buyers have overwhelmingly taken control. In my trading, I've found Bullish Engulfing patterns that form at key support levels or after extended downtrends to be especially reliable.

Bearish Engulfing Pattern
A two-candle reversal pattern where a larger red candle completely engulfs the previous green candle's body. Indicates sellers have taken control after an uptrend, often leading to a significant downside move.
The Bearish Engulfing pattern is the opposite of its bullish counterpart and signals potential downside reversals after uptrends.
Identification:
First candle: A green (bullish) candle with a relatively small real body
Second candle: A red (bearish) candle that completely "engulfs" the body of the previous candle
The pattern appears after an uptrend
Trading Strategy:
Entry: Enter when the second (red) candle closes
Stop-Loss: Place slightly above the highest point of the pattern
Target: Use a 2:1 risk-reward ratio or aim for previous support levels
I've observed that Bearish Engulfing patterns are particularly effective when they form at key resistance levels or after a market has become overextended. The pattern represents a decisive shift in control from buyers to sellers.

Hammer Pattern
A single-candle bullish reversal pattern with a small body at the top and a long lower wick at least twice the body's size. Represents strong rejection of lower prices after a downtrend, signaling potential bullish reversal.
The Hammer is a single-candle bullish reversal pattern that appears during downtrends.
Identification:
A candle with a small real body at the top of the range
A long lower wick (at least twice the size of the real body)
Little to no upper wick
The pattern appears after a downtrend
Trading Strategy:
Entry: Enter when the Hammer candle closes (though some traders wait for confirmation from the next candle)
Stop-Loss: Place below the low of the Hammer's wick
Target: Use a 2:1 risk-reward ratio or target previous resistance
The Hammer pattern is one of my personal favorites because it shows a clear rejection of lower prices. The long lower wick indicates that sellers initially pushed prices down, but buyers stepped in with enough force to push prices back up by the close – a powerful signal of potential reversal.

Shooting Star Pattern
A single-candle bearish reversal pattern with a small body at the bottom and a long upper wick at least twice the body's size. Shows rejection of higher prices during an uptrend, warning of a potential trend reversal.
The Shooting Star is a single-candle bearish reversal pattern that appears during uptrends.
Identification:
A candle with a small real body at the lower portion of the range
A long upper wick (at least twice the size of the real body)
Little to no lower wick
The pattern appears after an uptrend
Trading Strategy:
Entry: Enter when the Shooting Star candle closes
Stop-Loss: Place above the high of the Shooting Star's wick
Target: Use a 2:1 risk-reward ratio or aim for previous support
What makes the Shooting Star particularly powerful is that it captures a failed upside move. Prices initially extend higher (forming the upper wick) but then reverse and close near the low – showing that buyers lost control during the period.

Morning Star Pattern
A three-candle bullish reversal pattern starting with a strong red candle, followed by a small-bodied candle, and completed by a strong green candle. Represents a gradual shift from bearish to bullish sentiment at the end of a downtrend.
The Morning Star is a three-candle bullish reversal pattern that appears during downtrends.
Identification:
First candle: A strong bearish candle
Second candle: A small-bodied candle (often a Doji or Spinning Top) that gaps down
Third candle: A strong bullish candle that closes at least halfway up the first candle's body
The pattern appears after a downtrend
Trading Strategy:
Entry: Enter when the third candle closes
Stop-Loss: Place below the lowest point of the pattern
Target: Use a 2:1 risk-reward ratio or target previous resistance
The Morning Star represents a gradual shift in market psychology from bearish to bullish. The first candle shows sellers in control, the second shows indecision, and the third confirms buyers taking control – making it one of the more reliable reversal patterns.

Evening Star Pattern
A three-candle bearish reversal pattern starting with a strong green candle, followed by a small-bodied candle, and completed by a strong red candle. Shows momentum shifting from bullish to bearish at the end of an uptrend.
The Evening Star is a three-candle bearish reversal pattern that appears during uptrends.
Identification:
First candle: A strong bullish candle
Second candle: A small-bodied candle (often a Doji or Spinning Top) that gaps up
Third candle: A strong bearish candle that closes at least halfway down the first candle's body
The pattern appears after an uptrend
Trading Strategy:
Entry: Enter when the third candle closes
Stop-Loss: Place above the highest point of the pattern
Target: Use a 2:1 risk-reward ratio or aim for previous support
Like its bullish counterpart, the Evening Star captures a three-stage psychological shift in the market – from bullish control to indecision to bearish control.
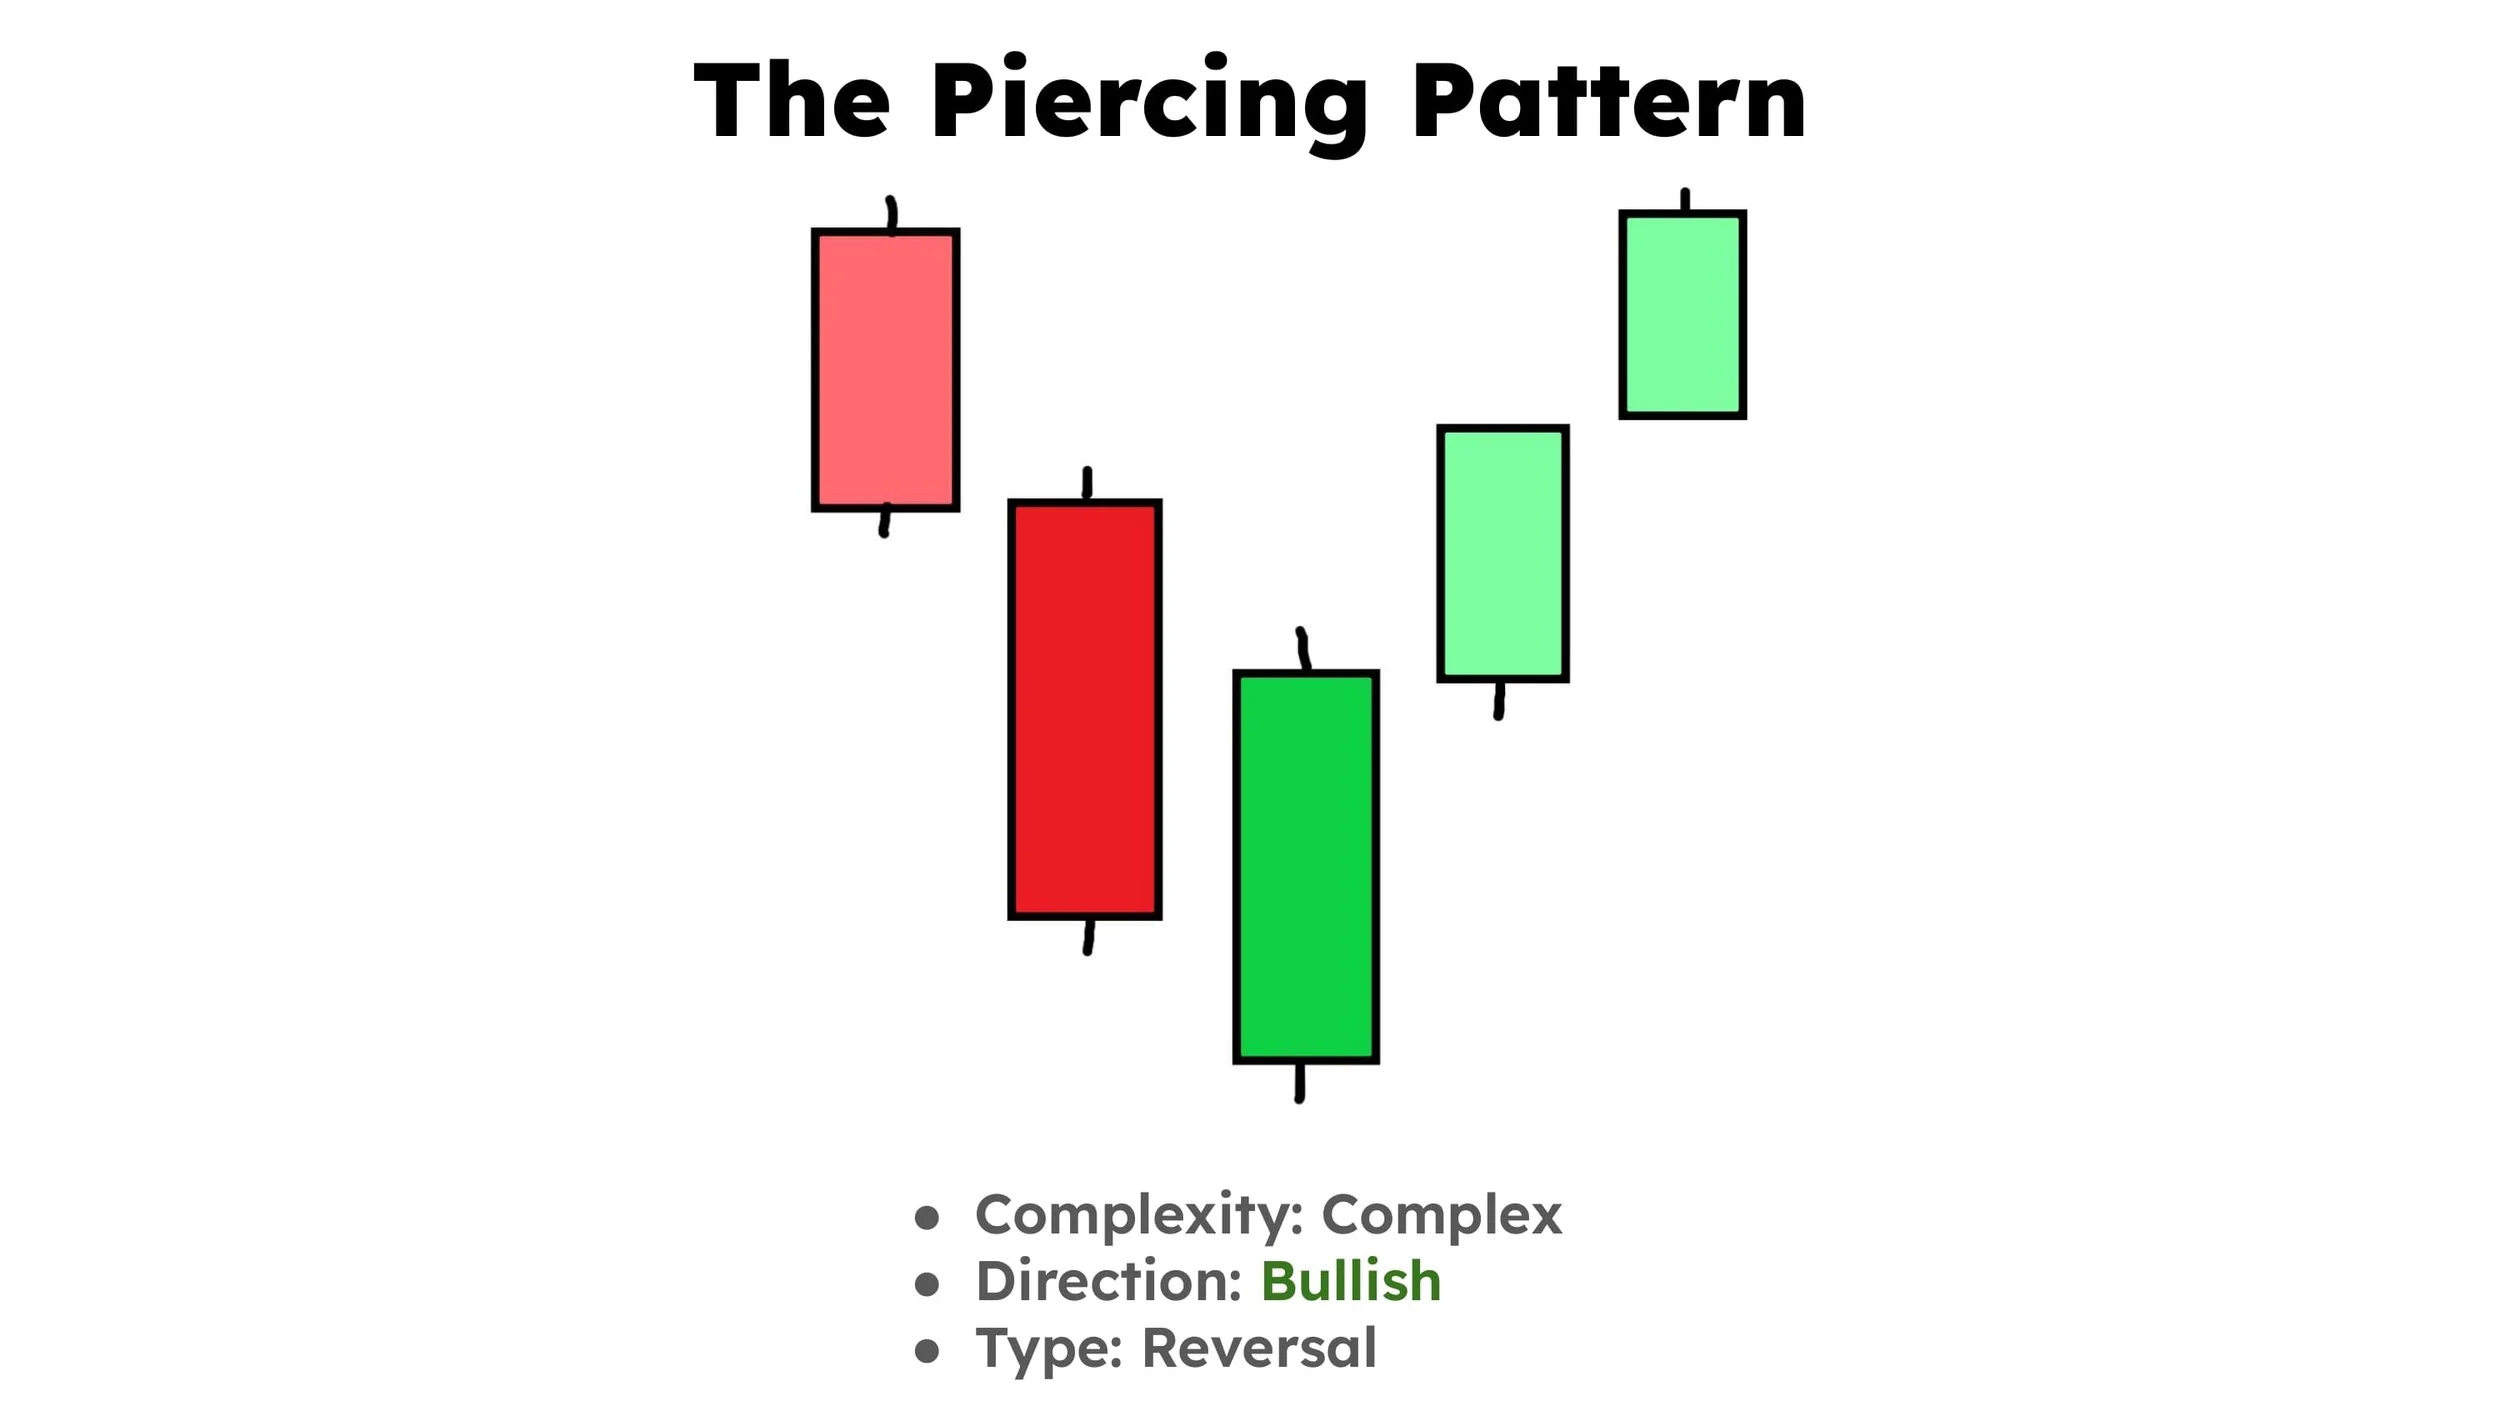
Piercing Pattern
A two-candle bullish reversal pattern where a green candle closes above the midpoint of the previous red candle's body. Demonstrates buying pressure beginning to overcome selling pressure after a downtrend.
The Piercing Pattern is a two-candle bullish reversal signal that occurs during downtrends.
Identification:
First candle: A bearish candle
Second candle: A bullish candle that opens below the previous close but closes above the midpoint of the first candle's body
The pattern appears after a downtrend
Trading Strategy:
Entry: Enter when the second candle closes
Stop-Loss: Place below the lowest point of the pattern
Target: Use a 2:1 risk-reward ratio or target previous resistance
The Piercing Pattern is essentially an early-stage Bullish Engulfing pattern. I've found that the key to trading this pattern successfully is to ensure that the second candle closes significantly above the midpoint of the first candle – the deeper the penetration, the stronger the signal.

Dark Cloud Cover Pattern
A two-candle bearish reversal pattern where a red candle opens above the previous green candle and closes below its midpoint. Signals selling pressure beginning to overcome buying pressure after an uptrend.
The Dark Cloud Cover is a two-candle bearish reversal signal that occurs during uptrends.
Identification:
First candle: A bullish candle
Second candle: A bearish candle that opens above the previous close but closes below the midpoint of the first candle's body
The pattern appears after an uptrend
Trading Strategy:
Entry: Enter when the second candle closes
Stop-Loss: Place above the highest point of the pattern
Target: Use a 2:1 risk-reward ratio or aim for previous support
Similar to the Piercing Pattern, the Dark Cloud Cover represents an early reversal signal. The deeper the second candle penetrates into the first candle's body, the stronger the reversal signal.

Inverted Hammer Pattern
A single-candle bullish reversal pattern with a small body at the bottom and a long upper wick, appearing during downtrends. Despite its shooting-star appearance, context makes it bullish as it indicates buying pressure starting to emerge.
The Inverted Hammer is a single-candle bullish reversal pattern that appears during downtrends.
Identification:
A candle with a small real body at the lower portion of the range
A long upper wick (at least twice the size of the real body)
Little to no lower wick
The pattern appears after a downtrend
Trading Strategy:
Entry: Some traders enter when the Inverted Hammer closes, but many prefer waiting for confirmation from the next candle
Stop-Loss: Place below the low of the pattern
Target: Use a 2:1 risk-reward ratio or target previous resistance
What makes the Inverted Hammer interesting is that it looks almost identical to a Shooting Star, but the context (appearing in a downtrend rather than an uptrend) completely changes its implications. This perfectly illustrates why understanding pattern context is crucial in candlestick trading.

Hanging Man Pattern
A single-candle bearish reversal pattern with a small body at the top and a long lower wick, appearing during uptrends. Resembles a hammer but its context after an uptrend makes it a warning sign of potential reversal.
The Hanging Man is a single-candle bearish reversal pattern that appears during uptrends.
Identification:
A candle with a small real body at the top of the range
A long lower wick (at least twice the size of the real body)
Little to no upper wick
The pattern appears after an uptrend
Trading Strategy:
Entry: Many traders wait for confirming bearish candle after the Hanging Man before entering
Stop-Loss: Place above the high of the pattern
Target: Use a 2:1 risk-reward ratio or aim for previous support
The Hanging Man is visually identical to the Hammer pattern, but appears in an uptrend rather than a downtrend. This subtle difference completely changes its implications – highlighting again the importance of context in pattern trading.
Continuation patterns suggest that the current trend will resume after a brief pause or consolidation. These patterns allow traders to enter established trends with favorable risk-reward profiles.

Rising Three Methods Pattern
A bullish continuation pattern with five candles: a strong green candle, three small red candles contained within the first candle's range, and a final strong green candle. Represents a controlled pullback before the uptrend continues.
The Rising Three Methods is a bullish continuation pattern that occurs during uptrends.
Identification:
First candle: A strong bullish candle
Middle candles: Three small bearish candles that stay within the range of the first candle (representing a small pullback)
Last candle: A strong bullish candle that closes above the close of the first candle
The pattern appears during an uptrend
Trading Strategy:
Entry: Enter when the fifth candle closes
Stop-Loss: Place below the lowest point of the pattern
Target: Measure the length of the initial impulse move and project it from the breakout point (measured move technique)
This pattern beautifully captures the essence of how trends unfold – advances followed by consolidations followed by further advances. The small bearish candles represent a controlled pullback before the trend resumes.

Falling Three Methods Pattern
A bearish continuation pattern with five candles: a strong red candle, three small green candles contained within the first candle's range, and a final strong red candle. Shows a brief consolidation before the downtrend resumes.
The Falling Three Methods is a bearish continuation pattern that occurs during downtrends.
Identification:
First candle: A strong bearish candle
Middle candles: Three small bullish candles that stay within the range of the first candle (representing a small pullback)
Last candle: A strong bearish candle that closes below the close of the first candle
The pattern appears during a downtrend
Trading Strategy:
Entry: Enter when the fifth candle closes
Stop-Loss: Place above the highest point of the pattern
Target: Measure the length of the initial impulse move and project it from the breakout point
Like its bullish counterpart, this pattern represents a controlled pullback within a larger downtrend before the primary trend resumes.
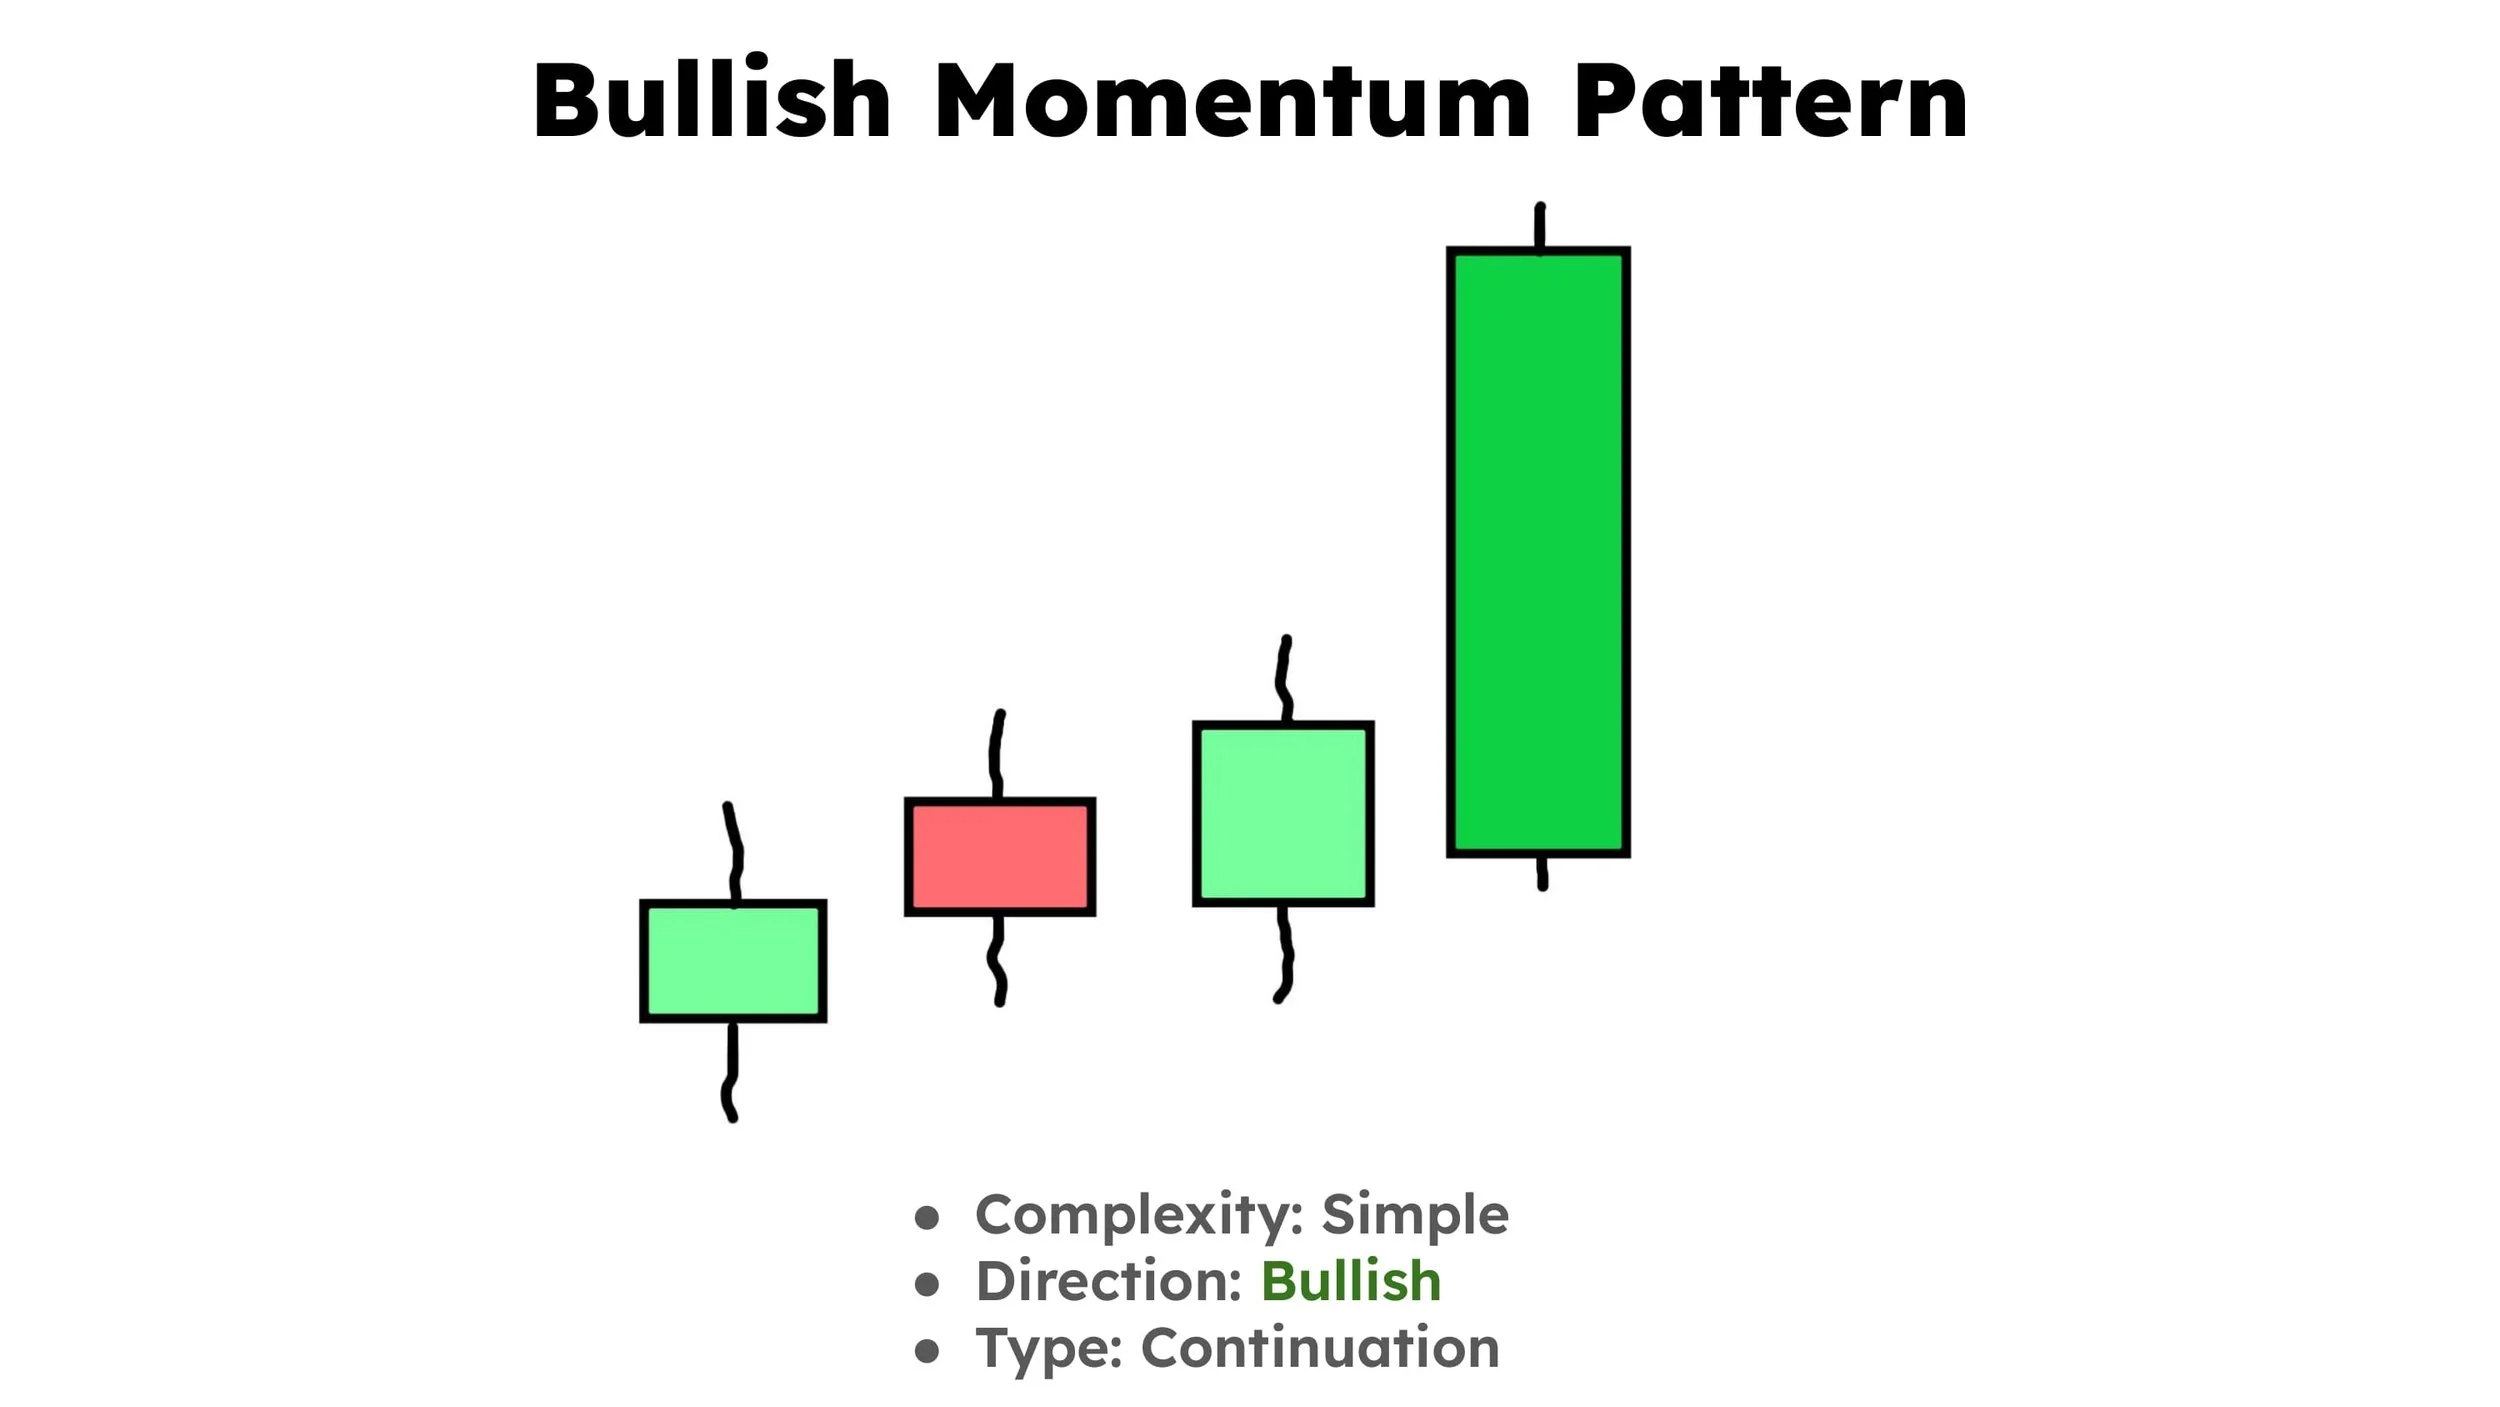
Bullish Momentum Candle
A strong green candle with a body at least twice the size of previous candles, appearing after consolidation or during uptrends. Signals sudden increase in buying pressure, often marking the beginning of a new impulse move.
The Bullish Momentum Candle is a powerful continuation signal during uptrends or at the end of consolidations.
Identification:
A bullish candle with a real body at least twice the size of the previous candles
Appears during an uptrend or after a period of consolidation
Often accompanied by increased volume
Trading Strategy:
Entry: Enter at the close of the momentum candle
Stop-Loss: Place below the most recent swing low
Target: Use a 2:1 risk-reward ratio or target the next resistance level
What makes momentum candles so effective is that they represent a sudden increase in buying pressure, often signaling the beginning of a new impulse move. I've found these particularly useful for entering trending markets after brief consolidations.

Bearish Momentum Candle
A strong red candle with a body at least twice the size of previous candles, appearing after consolidation or during downtrends. Demonstrates intensified selling pressure, suggesting further downside movement.
The Bearish Momentum Candle is the downside equivalent, signaling potential continuation of downtrends.
Identification:
A bearish candle with a real body at least twice the size of the previous candles
Appears during a downtrend or after a period of consolidation
Often accompanied by increased volume
Trading Strategy:
Entry: Enter at the close of the momentum candle
Stop-Loss: Place above the most recent swing high
Target: Use a 2:1 risk-reward ratio or target the next support level
Bearish momentum candles capture sudden increases in selling pressure and can provide excellent entries in downtrending markets.

Bull Flag Pattern
A continuation pattern consisting of a strong upward move followed by a series of smaller candles forming a slight downward channel. Represents a brief consolidation before the uptrend continues, offering favorable risk-reward entries.
The Bull Flag is among the most reliable continuation patterns in any market.
Identification:
An initial strong upward move (the "flagpole")
A series of small candles forming a slight downward channel or consolidation (the "flag")
The pattern appears during an uptrend
Trading Strategy:
Entry: Enter when price breaks above the upper boundary of the flag
Stop-Loss: Place below the lowest point of the flag
Target: Measure the length of the flagpole and project it from the breakout point
What I particularly like about flag patterns is their clear risk-reward structure. The measured move technique gives you a defined target, while the flag itself provides a compact area for stop placement.

Bear Flag Pattern
A continuation pattern consisting of a strong downward move followed by a series of smaller candles forming a slight upward channel. Shows a temporary pause in selling before the downtrend resumes, providing clear stop-loss placement.
The Bear Flag is the bearish equivalent, signaling potential continuation of downtrends.
Identification:
An initial strong downward move (the "flagpole")
A series of small candles forming a slight upward channel or consolidation (the "flag")
The pattern appears during a downtrend
Trading Strategy:
Entry: Enter when price breaks below the lower boundary of the flag
Stop-Loss: Place above the highest point of the flag
Target: Measure the length of the flagpole and project it from the breakout point
Bear flags often provide excellent short-selling opportunities with clearly defined risk parameters.

Bullish Runaway Gap
A price gap where a candle opens significantly higher than the previous candle's high, with no price overlap. Signals such strong buying pressure that price literally "jumps" higher without trading at intermediate levels.
Gaps are powerful continuation signals that occur when price "jumps" from one candle to the next without trading in the intermediate price range.
Identification:
A gap in price where the lowest point of a candle is above the highest point of the previous candle
Occurs during an uptrend
Often accompanied by increased volume
Trading Strategy:
Entry: Enter at the open after the gap
Stop-Loss: Place below the low of the gap
Target: Use a 2:1 risk-reward ratio or target the next resistance level
Runaway gaps represent such strong buying pressure that price literally "jumps" higher without trading at intermediate levels. These can be particularly powerful in fast-moving markets like cryptocurrencies.

Bearish Runaway Gap
A price gap where a candle opens significantly lower than the previous candle's low, with no price overlap. Indicates intense selling pressure causing price to "jump" lower without trading at intermediate levels.
The Bearish Runaway Gap is the downside equivalent, signaling potential continuation of downtrends.
Identification:
A gap in price where the highest point of a candle is below the lowest point of the previous candle
Occurs during a downtrend
Often accompanied by increased volume
Trading Strategy:
Entry: Enter at the open after the gap
Stop-Loss: Place above the high of the gap
Target: Use a 2:1 risk-reward ratio or target the next support level
Like their bullish counterparts, bearish gaps represent such strong selling pressure that price literally "jumps" lower without trading at intermediate levels.
Doji and Spinning Top candles belong to a special category called "indecision candles." They reveal important information about market psychology and potential turning points.
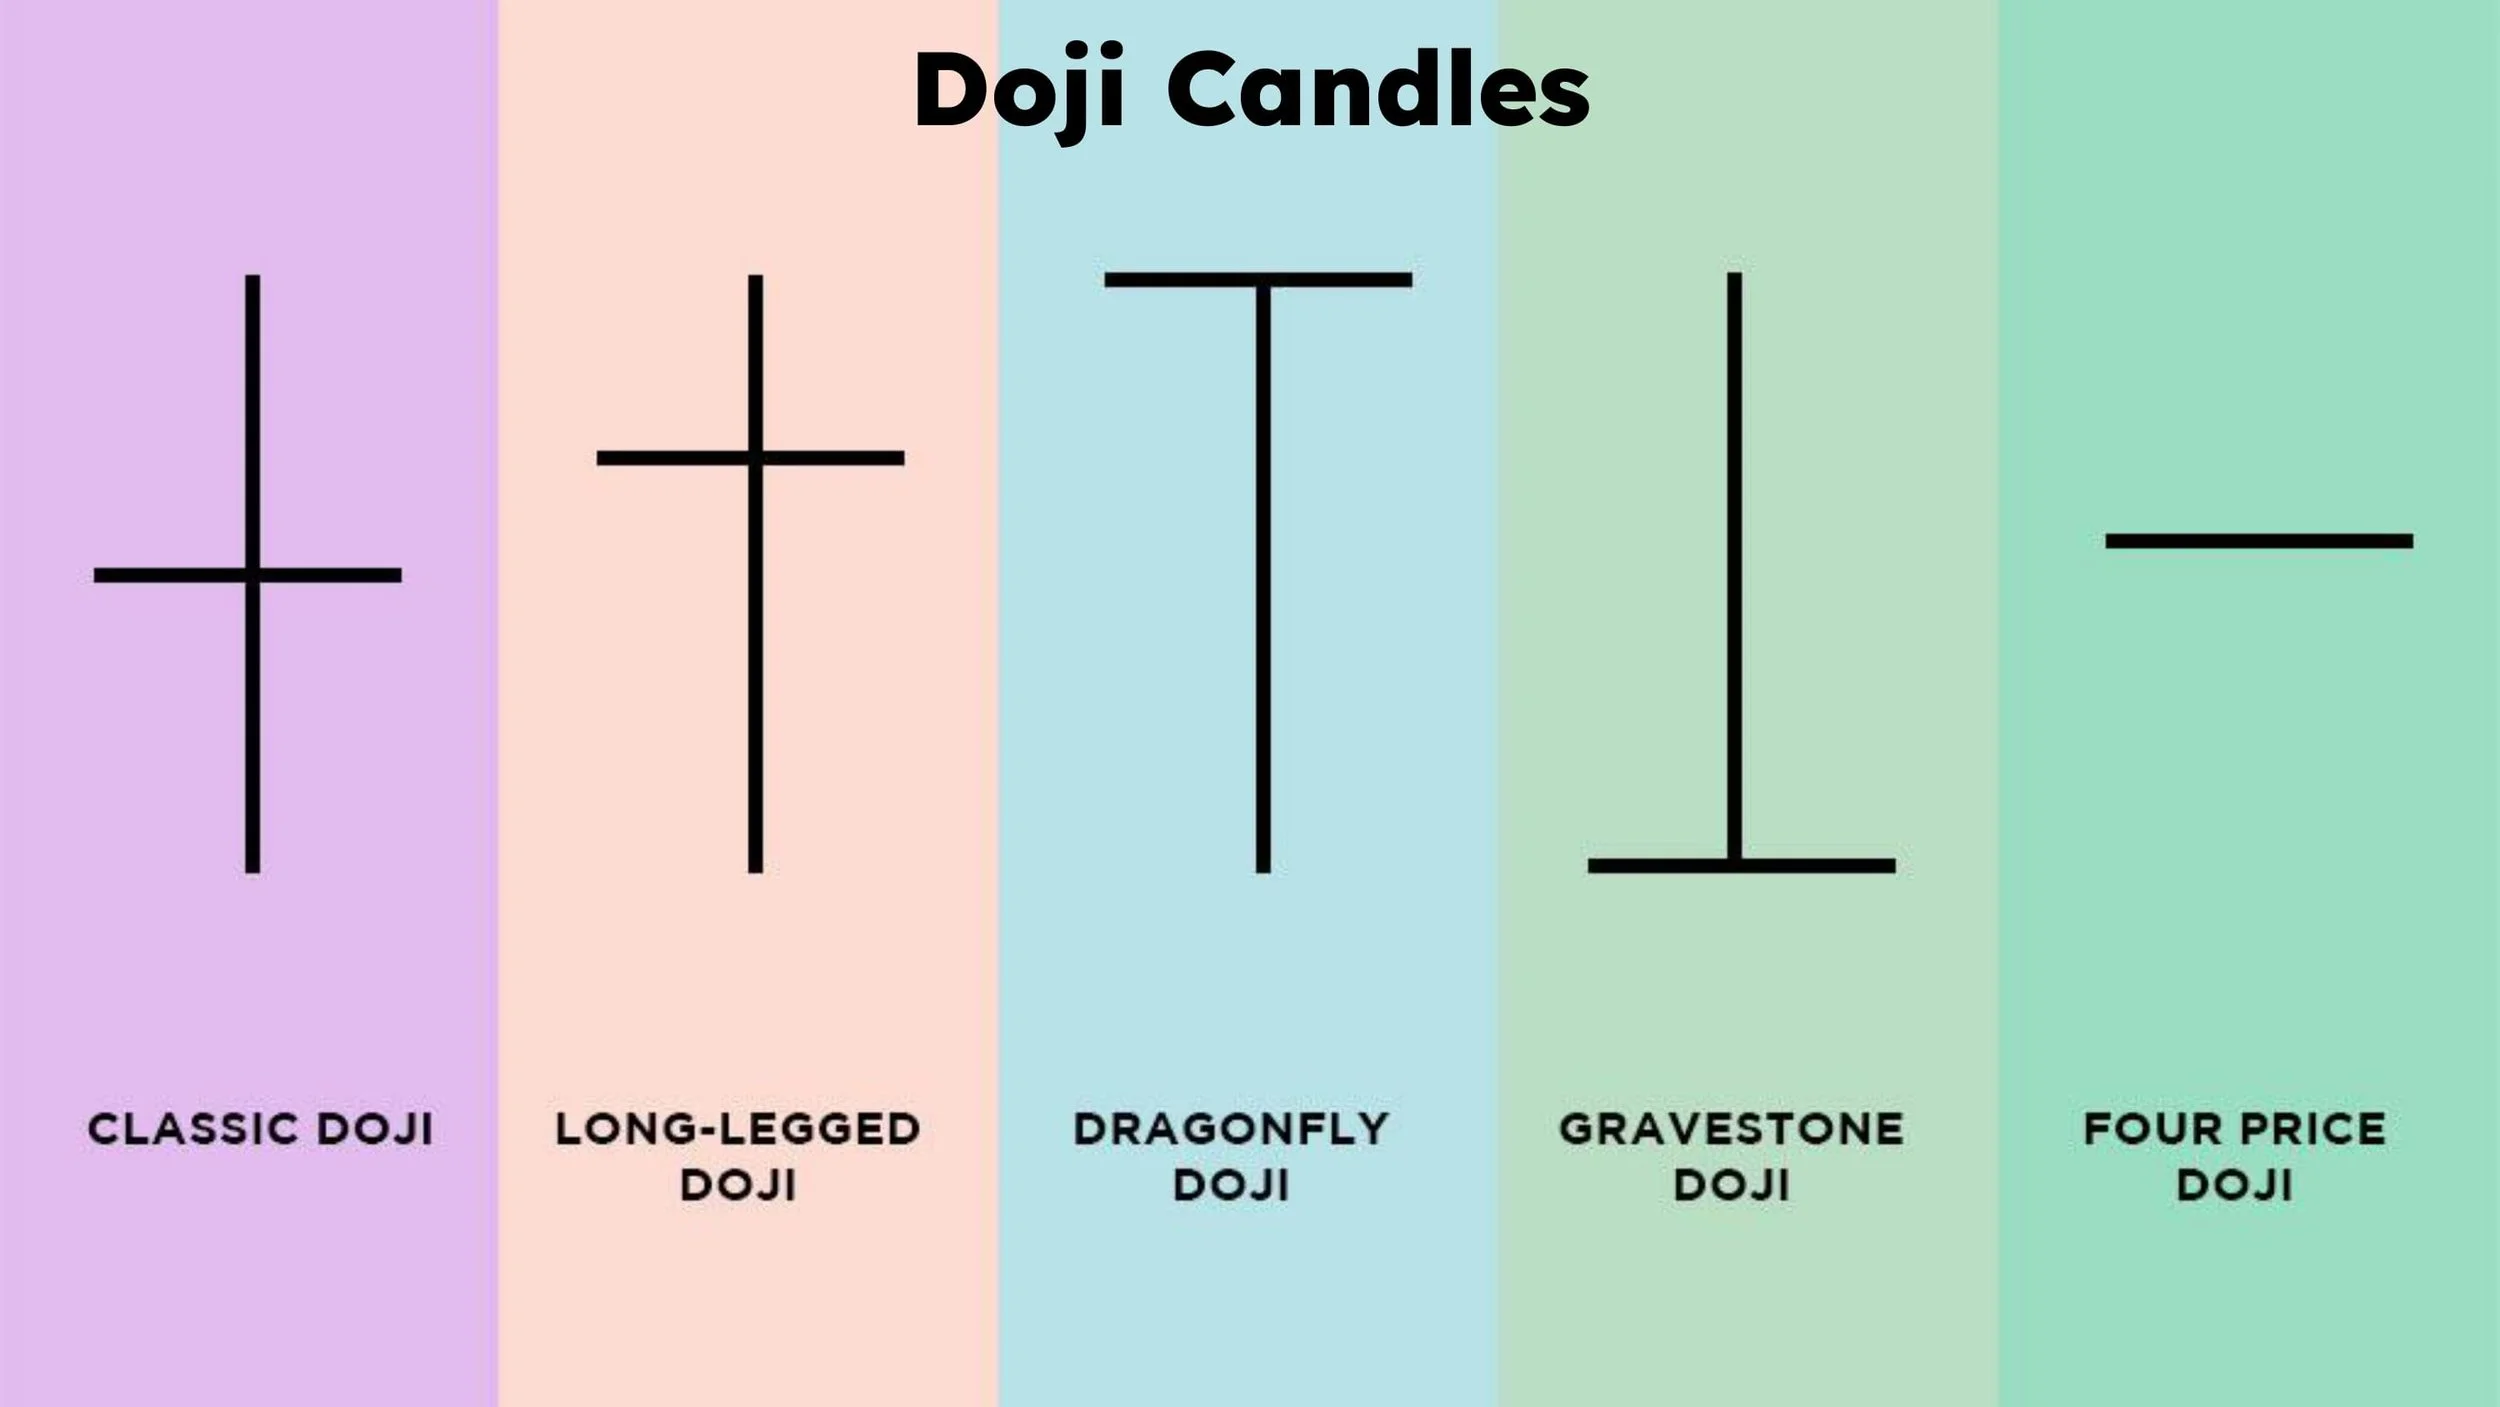
Doji Candle
A candle with virtually identical open and close prices, creating a cross-like appearance. Signals indecision in the market, and when appearing after extended trends, often warns of potential reversals.
A Doji forms when the opening and closing prices are virtually identical, creating a candle with almost no real body.
Types of Doji candles:
Classic Doji: Has equal upper and lower wicks, signaling pure indecision
Long-Legged Doji: Has long upper and lower wicks, showing extreme volatility and uncertainty
Dragonfly Doji: Has a long lower wick and no upper wick, often bullish at support levels
Gravestone Doji: Has a long upper wick and no lower wick, often bearish at resistance levels
In my trading experience, Dojis are most significant when they appear after extended trends or at key support/resistance levels. They signal exhaustion of the prevailing trend and potential reversals.
Trading with Doji Candles:
After uptrends: Dojis, especially Gravestone Dojis, can signal potential reversals
After downtrends: Dojis, particularly Dragonfly Dojis, may indicate potential bullish reversals
During ranges: Dojis often signal continued indecision and may not provide actionable signals
The context is crucial – a Doji by itself isn't necessarily a trading signal, but when combined with other factors (trend analysis, support/resistance, volume), it can provide valuable insights.

Spinning Top Candle
A candle with a small real body and long wicks extending above and below. Indicates uncertainty with neither buyers nor sellers gaining clear control, often suggesting exhaustion in the current trend.
Spinning Tops are similar to Dojis but have slightly larger real bodies. They still feature long upper and lower wicks relative to their bodies.
Identification:
Small real body (can be either bullish or bearish)
Long upper and lower wicks (ideally both wicks are longer than the body)
Like Dojis, Spinning Tops indicate indecision and potential exhaustion in the current trend. They're particularly significant when appearing at the end of strong trends or at key price levels.
Trading with Spinning Tops:
After uptrends: May signal weakening momentum and potential reversals
After downtrends: Can indicate diminishing selling pressure
Multiple consecutive Spinning Tops: Often signal consolidation before the next significant move
While many traders overlook these indecision candles, I've found them incredibly valuable as early warning signals of potential trend changes. When I see multiple Dojis or Spinning Tops appearing after a strong trend, I become much more cautious and prepare for possible reversals.
Now that we've covered the most important candlestick patterns, let's discuss some practical strategies for implementing them in your trading.
Candlestick patterns become significantly more powerful when they form at key support or resistance levels. For example:
A Bullish Engulfing pattern at a strong support level has a much higher probability of success than the same pattern in the middle of nowhere
A Bearish Engulfing or Shooting Star at a major resistance level can provide excellent shorting opportunities
I always recommend looking for confluence – when multiple technical factors align at the same price level, the signal becomes much stronger.
No pattern works 100% of the time, which is why risk management is crucial. Here are my guidelines:
Position Sizing: Never risk more than 1-2% of your trading capital on any single trade
Stop-Loss Placement: Always use stop-losses based on the pattern's structure (as outlined in each pattern's strategy section)
Risk-Reward Ratio: Aim for a minimum risk-reward ratio of 1:2 (risking $1 to potentially make $2)
Remember, even if your pattern analysis is correct only 50% of the time, with a 1:2 risk-reward ratio, you can still be profitable in the long run.
One approach that has significantly improved my pattern trading is analyzing patterns across multiple timeframes. For example:
Use the higher timeframe to identify the overall trend
Look for continuation patterns on the intermediate timeframe
Use the lower timeframe for precise entry timing
This multi-timeframe approach helps filter out low-probability setups and focus on trades aligned with the larger trend.
Pattern failures – when a pattern forms but doesn't behave as expected – can actually provide valuable information. For instance:
A failed Bullish Engulfing pattern (price drops instead of rising) often indicates exceptional bearish strength
A failed bearish pattern can signal unusual bullish strength
Many professional traders actually look for these pattern failures as trading opportunities in themselves.
Volume provides confirmation for candlestick patterns. For the most reliable signals:
Reversal patterns should ideally be accompanied by above-average volume
Continuation patterns often show declining volume during consolidation and increasing volume on the breakout
Adding volume analysis to your candlestick trading can significantly improve your success rate.
Take your trading knowledge to the next level by joining the Mind Math Money community on YouTube. Enhance your candlestick pattern trading skills with additional resources and community support.
For beginners, I recommend focusing on Bullish and Bearish Engulfing patterns, Hammers, and Shooting Stars. These patterns are visually distinctive, occur frequently, and have clear implications. They also provide well-defined risk parameters for stop-loss placement. Engulfing patterns in particular tend to be reliable across most markets and timeframes, making them excellent starting points for new traders.
Candlestick patterns work across all financial markets and timeframes because they reflect universal market psychology – the interaction between buyers and sellers. However, their reliability can vary. They tend to be more reliable on higher timeframes (daily and weekly charts) compared to very short timeframes (1-minute or 5-minute charts) where market noise can create false signals. Additionally, patterns often work better in liquid markets where price discovery is more efficient.
When multiple patterns appear, prioritize them based on: 1) Complexity – complex patterns (multiple candles) generally override simple ones, 2) Location – patterns at key support/resistance levels carry more weight, 3) Confirmation – patterns with confirming volume or momentum are more reliable, and 4) Higher timeframe alignment – patterns that align with the higher timeframe trend deserve more attention. For conflicting signals, wait for additional confirmation before taking action.
While the pattern itself provides valuable information, where it appears on the chart (context) is often more important. A textbook-perfect pattern in an irrelevant chart location may fail, while even an imperfect pattern at a critical support/resistance level might produce excellent results. The most powerful setups occur when a well-formed pattern appears at key technical levels, such as trend lines, Fibonacci levels, or previous support/resistance zones.
There are several effective methods for setting profit targets: 1) Risk-reward ratios – using 1:2 or 1:3 multiples of your initial risk, 2) Previous support/resistance levels – taking profits at established market turning points, 3) Measured moves – particularly effective for patterns like flags (measure the "flagpole" height and project it from the breakout point), and 4) Trailing stops – allowing winning trades to run while protecting profits. I typically use a combination of these approaches based on market conditions.
Even perfect patterns can fail because markets are influenced by countless factors beyond chart patterns. Common reasons for failure include: 1) Unexpected news or events overriding technical factors, 2) Large institutional orders disrupting normal price action, 3) Lack of sufficient volume to sustain the move, and 4) Conflicting signals on higher timeframes. This is precisely why risk management is crucial – no pattern works 100% of the time, and preserving capital during inevitable failures is essential for long-term success.
Mastering candlestick patterns is a journey that can significantly enhance your trading results, but it requires both knowledge and practical experience. Throughout this guide, we've covered the essential patterns that have consistently proven their value across different markets and timeframes.
Remember that candlestick patterns are not magic bullets but rather tools that help you read market psychology. Their true power emerges when you combine them with other technical analysis tools and proper risk management.
Here are my final tips for successful candlestick pattern trading:
Start with a few patterns: Focus on mastering 3-5 patterns before expanding your repertoire
Practice identification: Study historical charts to identify patterns before they complete
Journal your trades: Record both successful and failed pattern trades to identify what works best for your trading style
Be patient: Wait for high-quality setups rather than forcing trades on imperfect patterns
Respect the context: Always consider where patterns appear in relation to trends and key levels
By incorporating these candlestick techniques into your trading toolkit, you'll develop a deeper understanding of market dynamics and potentially improve your ability to identify high-probability trading opportunities.
What candlestick pattern has worked best in your trading experience? Which one will you try next? I'd love to hear about your journey with these powerful technical analysis tools.
Disclaimer: Trading involves risk of loss. This educational content should not be construed as financial advice. Always conduct your own research and consider your risk tolerance before trading.
Theory becomes skill through practice. Bybit's demo account lets you apply candlestick pattern strategies in real market conditions without risking real capital. Perfect for testing which patterns work best for your trading style and market conditions.
Dive deeper into the powerful Doji family of candlestick patterns and learn how to trade these key indecision signals.
Learn how to combine candlestick patterns with other price action techniques for a comprehensive trading approach.
Discover how to identify optimal price levels for applying your candlestick pattern strategies for maximum effectiveness.
Take your candlestick pattern knowledge to the next level with advanced price action concepts and strategies.
I bought my first stock at 16, and since then, financial markets have fascinated me. Understanding how human behavior shapes market structure and price action is both intellectually and financially rewarding.
I’ve always loved teaching—helping people have their “aha moments” is an amazing feeling. That’s why I created Mind Math Money to share insights on trading, technical analysis, and finance.
Over the years, I’ve built a community of over 200,000 YouTube followers, all striving to become better traders. Check out my YouTube channel for more insights and tutorials.