

The Ultimate Candlestick Pattern Trading Guide: Master 15+ Powerful Formations
Discover how candlestick patterns reveal the psychological battle between buyers and sellers in any market. Dating back to 18th century Japanese rice traders, these visual price formations have stood the test of time because they work. Learn how to identify powerful patterns like Engulfing, Hammer, and Doji candles to spot potential reversals and continuations before other traders. Master these formations to gain a significant edge in your trading.

Best TradingView Indicators for 2025: Custom Settings Included
Discover how to transform standard TradingView indicators into powerful trading tools with these professional-level custom settings. Learn the my exact MACD, Pivot Point, and Volume Footprint configurations, also used by expert traders to spot reversals faster and identify high-probability trading zones.

Mastering Price Action Trading: The Complete Guide for 2025
Price action trading is a powerful approach focused on analyzing how price moves in real-time rather than relying solely on lagging indicators. This comprehensive guide explores the fundamentals of price action, from essential candlestick patterns to their application at key support and resistance levels. You'll learn how to identify high-probability setups, confirm trades with volume analysis, and develop a complete trading plan that works across stocks, forex, and cryptocurrency markets.

Volume Footprint Charts: The Complete Guide to Reading Order Flow (2025)
Feel like traditional candlestick charts miss crucial market insights? Volume footprint charts reveal hidden buying and selling pressures at each price level, providing clarity traditional charts can't match.
Discover key concepts like Delta, Point of Control, and effective TradingView Volume footprint settings. Improve your trading strategy and discover profitable opportunities today!

What is Technical Analysis? A Beginner’s Guide (2025)
What is Technical Analysis? It’s a question many beginners ask when they are new to the world of trading. In simple terms, technical analysis involves studying past price movements to make informed predictions about future price action. It is widely used in stocks, forex, and cryptocurrency trading to identify buy and sell opportunities based on historical data. In this article, you will learn everything you need to grasp the basics of technical analysis.

The Ultimate Chart Patterns Trading Course: Master Price Patterns for Stocks, Forex, Crypto & More
Learn everything you need to know about chart patterns trading with this ultimate course. Whether you're into forex, day trading, or crypto, this comprehensive chart pattern guide covers it all, from the fundamentals of technical analysis with price patterns to more advanced trading strategies for bullish and bearish markets.

The Ultimate Guide to TradingView Chart Types: Understanding Different Visualization Methods
Looking to master TradingView charts? From basic line charts to advanced Volume Footprint analysis, this guide reveals how professional traders choose and use different chart types for technical analysis. Learn which visualization methods work best for your trading strategy and discover powerful features that can enhance your market analysis. Whether you're analyzing stocks, crypto, or forex, you'll understand exactly when to use each chart type for optimal trading decisions.
What is Day Trading? (Explained For Beginners)
Learn the basics of day trading, including how to get started with stocks, crypto, forex, and more. This guide explains what day trading is and the strategies you need to navigate fast-moving markets confidently.

Fundamental Analysis vs Technical Analysis: Which is Better for Trading Stocks?
Curious about the differences between fundamental and technical analysis? Discover which method suits your trading style and whether you're a long-term investor or a short-term trader. Learn the tools, strategies, and insights to make smarter stock market decisions today!

Top Down Analysis in Forex, Crypto and Stock Trading: Price Action & Market Structure
Top-Down Analysis is a proven technique used by professional traders in forex, stock, and crypto markets to dramatically improve trade accuracy. By strategically analyzing higher, medium, and lower time frames, you'll identify hidden trends, powerful support and resistance levels, and precise entry and exit points that other traders miss. Whether you're a beginner or experienced trader, this step-by-step guide will show you exactly how to implement top-down analysis to potentially transform your trading results.
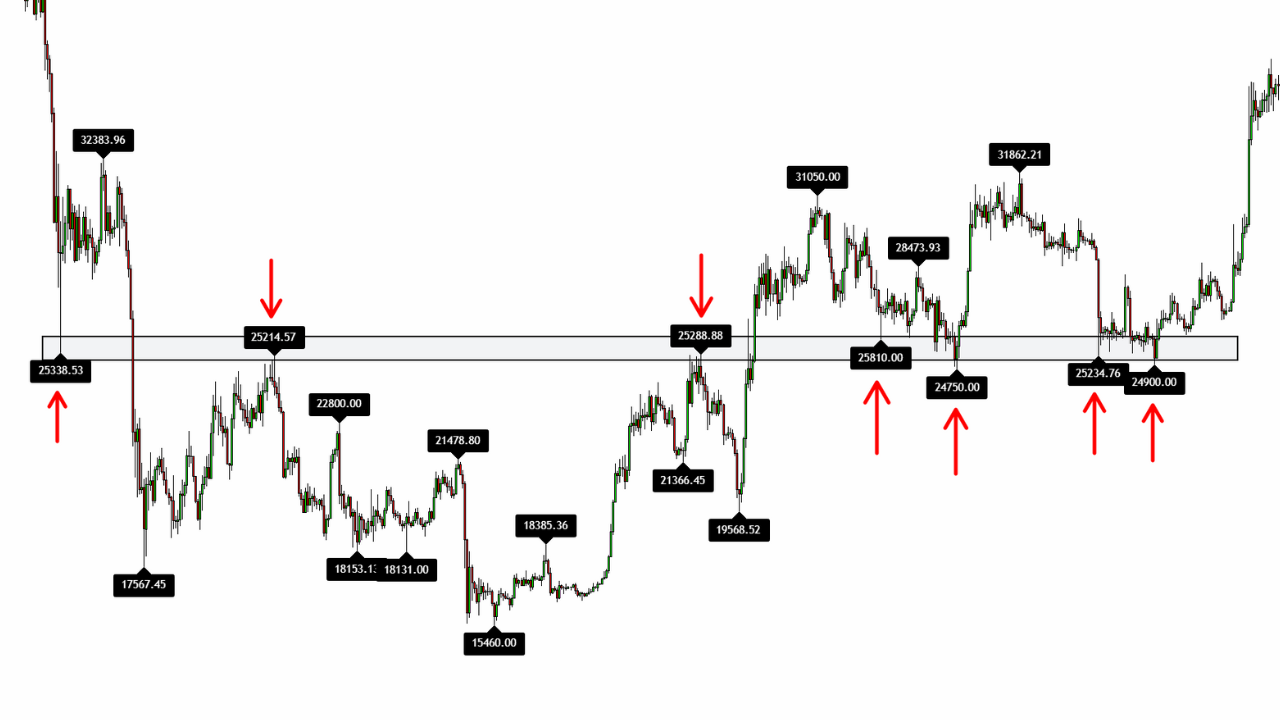
Support and Resistance TradingView Indicator: The Pivot Point Trading Strategy
The Pivot Points High and Low Indicator is one of the most effective tools on TradingView for identifying key support and resistance levels. In this article, you'll learn how to set it up and use it step-by-step to potentially improve your trading strategy.

Volume Analysis in Trading: A Guide to Volume Indicators and Strategies
Volume analysis is a critical skill that separates successful traders from the crowd. In this comprehensive guide, we'll break down exactly what volume trading is, why it's essential for confirming price movements, and how to combine volume indicators with price action to identify high-probability trading opportunities. Whether you're trading stocks, forex, or cryptocurrencies, mastering volume analysis will help you confirm trends, spot potential reversals, and make more confident trading decisions.

How to Draw Fibonacci Extensions: Fibonacci Extension Levels, Targets, and Trading Strategy
In this Fibonacci Extension trading guide, we delve into how to identify key target levels using Fibonacci extensions. Learn to pinpoint precise entry and exit points by recognizing swing highs and lows, and discover the significance of critical levels like 0.786, 1.0, and 1.618.
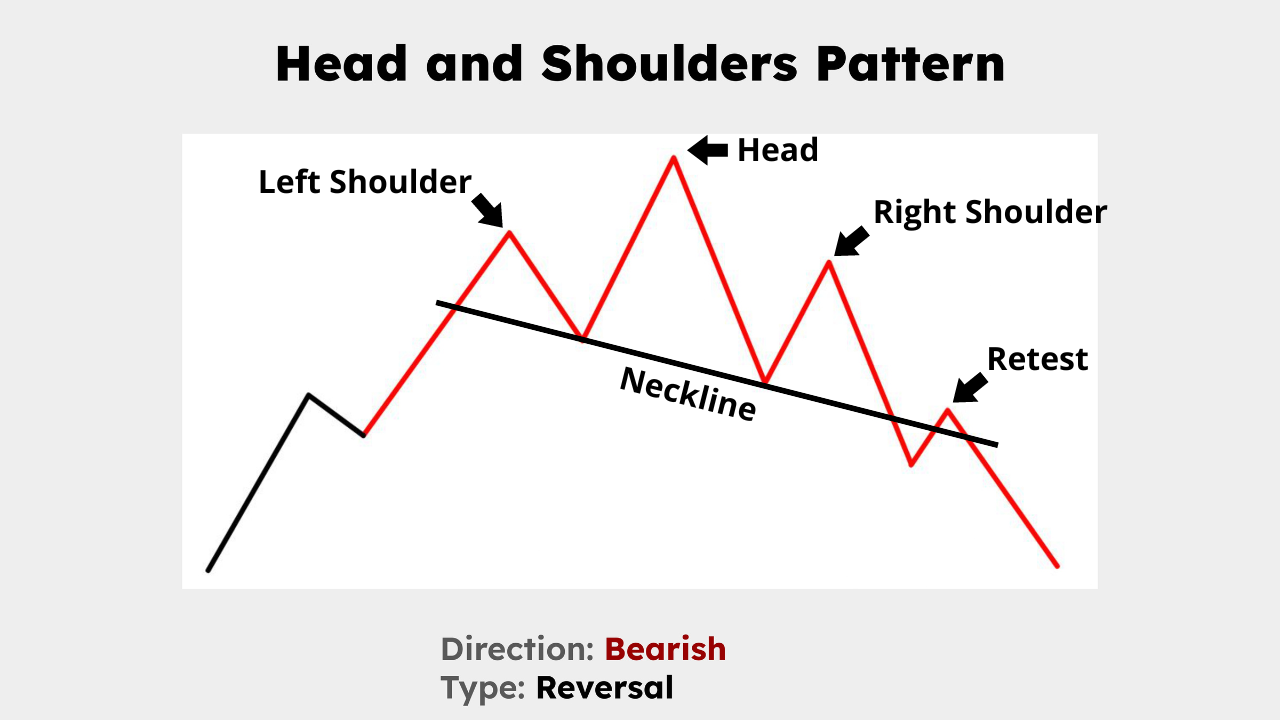
Understanding the Head and Shoulders Chart Pattern: A Comprehensive Guide
Unlock the secrets of the head and shoulders pattern, a crucial tool for spotting bearish reversals. This guide covers its structure, identification, and trading strategies, including entry points, stop loss placements and profit targets. Perfect for traders at any level, this article provides the insights needed to predict market trends effectively. Improve your trading skills with real market examples and expert tips.

How to Trade the Double Top and Double Bottom Pattern
Unlock the potential of Double Top and Double Bottom chart patterns with this practical guide. These powerful patterns clearly signal market reversals, making them invaluable tools whether you're trading forex, crypto, or stocks. Learn how to spot these patterns, trade them effectively, and confidently capitalize on shifts in market direction.

How to Use the RSI Indicator in TradingView (2025)
Master the Relative Strength Index (RSI) in TradingView with this concise guide. Learn to set up and interpret this powerful momentum indicator to boost your trading decisions. Uncover the meaning of overbought (above 70) and oversold (below 30) levels, and sharpen your skills in spotting RSI divergences to predict market reversals. Perfect for beginners and seasoned traders alike, this updated 2025 guide also explores pairing RSI with moving averages for smarter, more confident technical analysis. Start elevating your trades today!