
The Ultimate Chart Patterns Trading Course: Master Price Patterns for Stocks, Forex, Crypto & More
If you’re serious about trading, you already know that chart patterns are one of the key tools in technical analysis. Whether you trade stocks, forex, or cryptocurrencies, understanding and correctly applying chart pattern trading techniques can help you identify trends, pinpoint entry and exit points, and ultimately manage risk more effectively.
In this comprehensive guide, we will take you through a complete chart pattern trading course, from the basics to advanced strategies. We’ll cover every important formation you need to know, including double bottom and double top patterns, bull and bear flags, head and shoulders formations, wedge patterns, triangles, and even cup and handle patterns. This article is designed to provide you with the clarity and actionable strategies you need to trade confidently using chart patterns.
Table of Contents
- Introduction to Chart Patterns
- Understanding Chart Pattern Classifications
-
In-Depth Look at Key Chart Patterns
- Double Bottom Pattern
- Double Top Pattern
- Bull Flag Pattern
- Bear Flag Pattern
- Head and Shoulders Pattern
- Inverse Head and Shoulders Pattern
- Falling Wedge Pattern
- Rising Wedge Pattern
- Symmetrical Triangle Pattern
- Broadening Range Pattern
- Cup and Handle Pattern
- Reverse Cup and Handle Pattern
- Ascending Triangle Pattern
- Descending Triangle Pattern
- Trading Strategies and Tips
- Final Thoughts: Mastering Chart Pattern Trading
Introduction to Chart Patterns
Chart patterns are a core component of technical analysis, offering visual clues that help traders forecast future price movements. These patterns emerge from historical price data and tend to repeat across different markets and time frames. By mastering chart patterns, you will be better equipped to:
Identify Trends: Recognize when the market is likely to continue its current trend or when a reversal might occur.
Pinpoint Entry/Exit Points: Determine precise levels for entering or exiting a trade.
Manage Risk: Establish logical stop-loss levels and profit targets based on the structure of the pattern.
One of the key benefits of chart patterns is their universality. They appear in all markets—from stocks to forex to cryptocurrencies—and across various trading styles, whether you’re day trading, swing trading, or scalping. This versatility makes chart pattern trading an essential skill for anyone looking to improve their technical analysis and overall trading performance.
Understanding Chart Pattern Classifications
Before diving into specific chart patterns, it’s important to understand how they are classified. Every chart pattern can be described in terms of two main attributes: direction and type.

All chart patterns in trading have a direction and a type. In technical analysis, each pattern is classified by its directional bias, where bullish patterns suggest an upward move while bearish patterns indicate a downward trend, and by its type, such as reversal, continuation, or uncertain.
Direction
Bullish Patterns: These patterns indicate that the price is likely to move upward. They are typically observed at the bottom of a downtrend or during periods of consolidation before an upward move.
Bearish Patterns: These patterns suggest that the price is likely to decline. They usually appear at the top of an uptrend or after a period of consolidation before the price falls.

The direction of a chart pattern can be either bullish or bearish and it defines the price direction AFTER the pattern has appeared.
Type
Reversal Patterns: Reversal patterns signal a change in the current trend. For example, a double bottom pattern indicates that a downtrend may be ending and that a bullish reversal is imminent.
Continuation Patterns: Continuation patterns indicate that the prevailing trend will continue after a brief period of consolidation. Bull flags and ascending triangles are classic examples.
Uncertain Patterns: Some patterns, such as symmetrical triangles or broadening ranges, can be ambiguous. They may require additional confirmation to decide whether the trend will resume or reverse.
Understanding both the direction and the type of a chart pattern is essential. It not only helps in identifying the pattern correctly but also in setting up proper trade entries and risk management strategies.
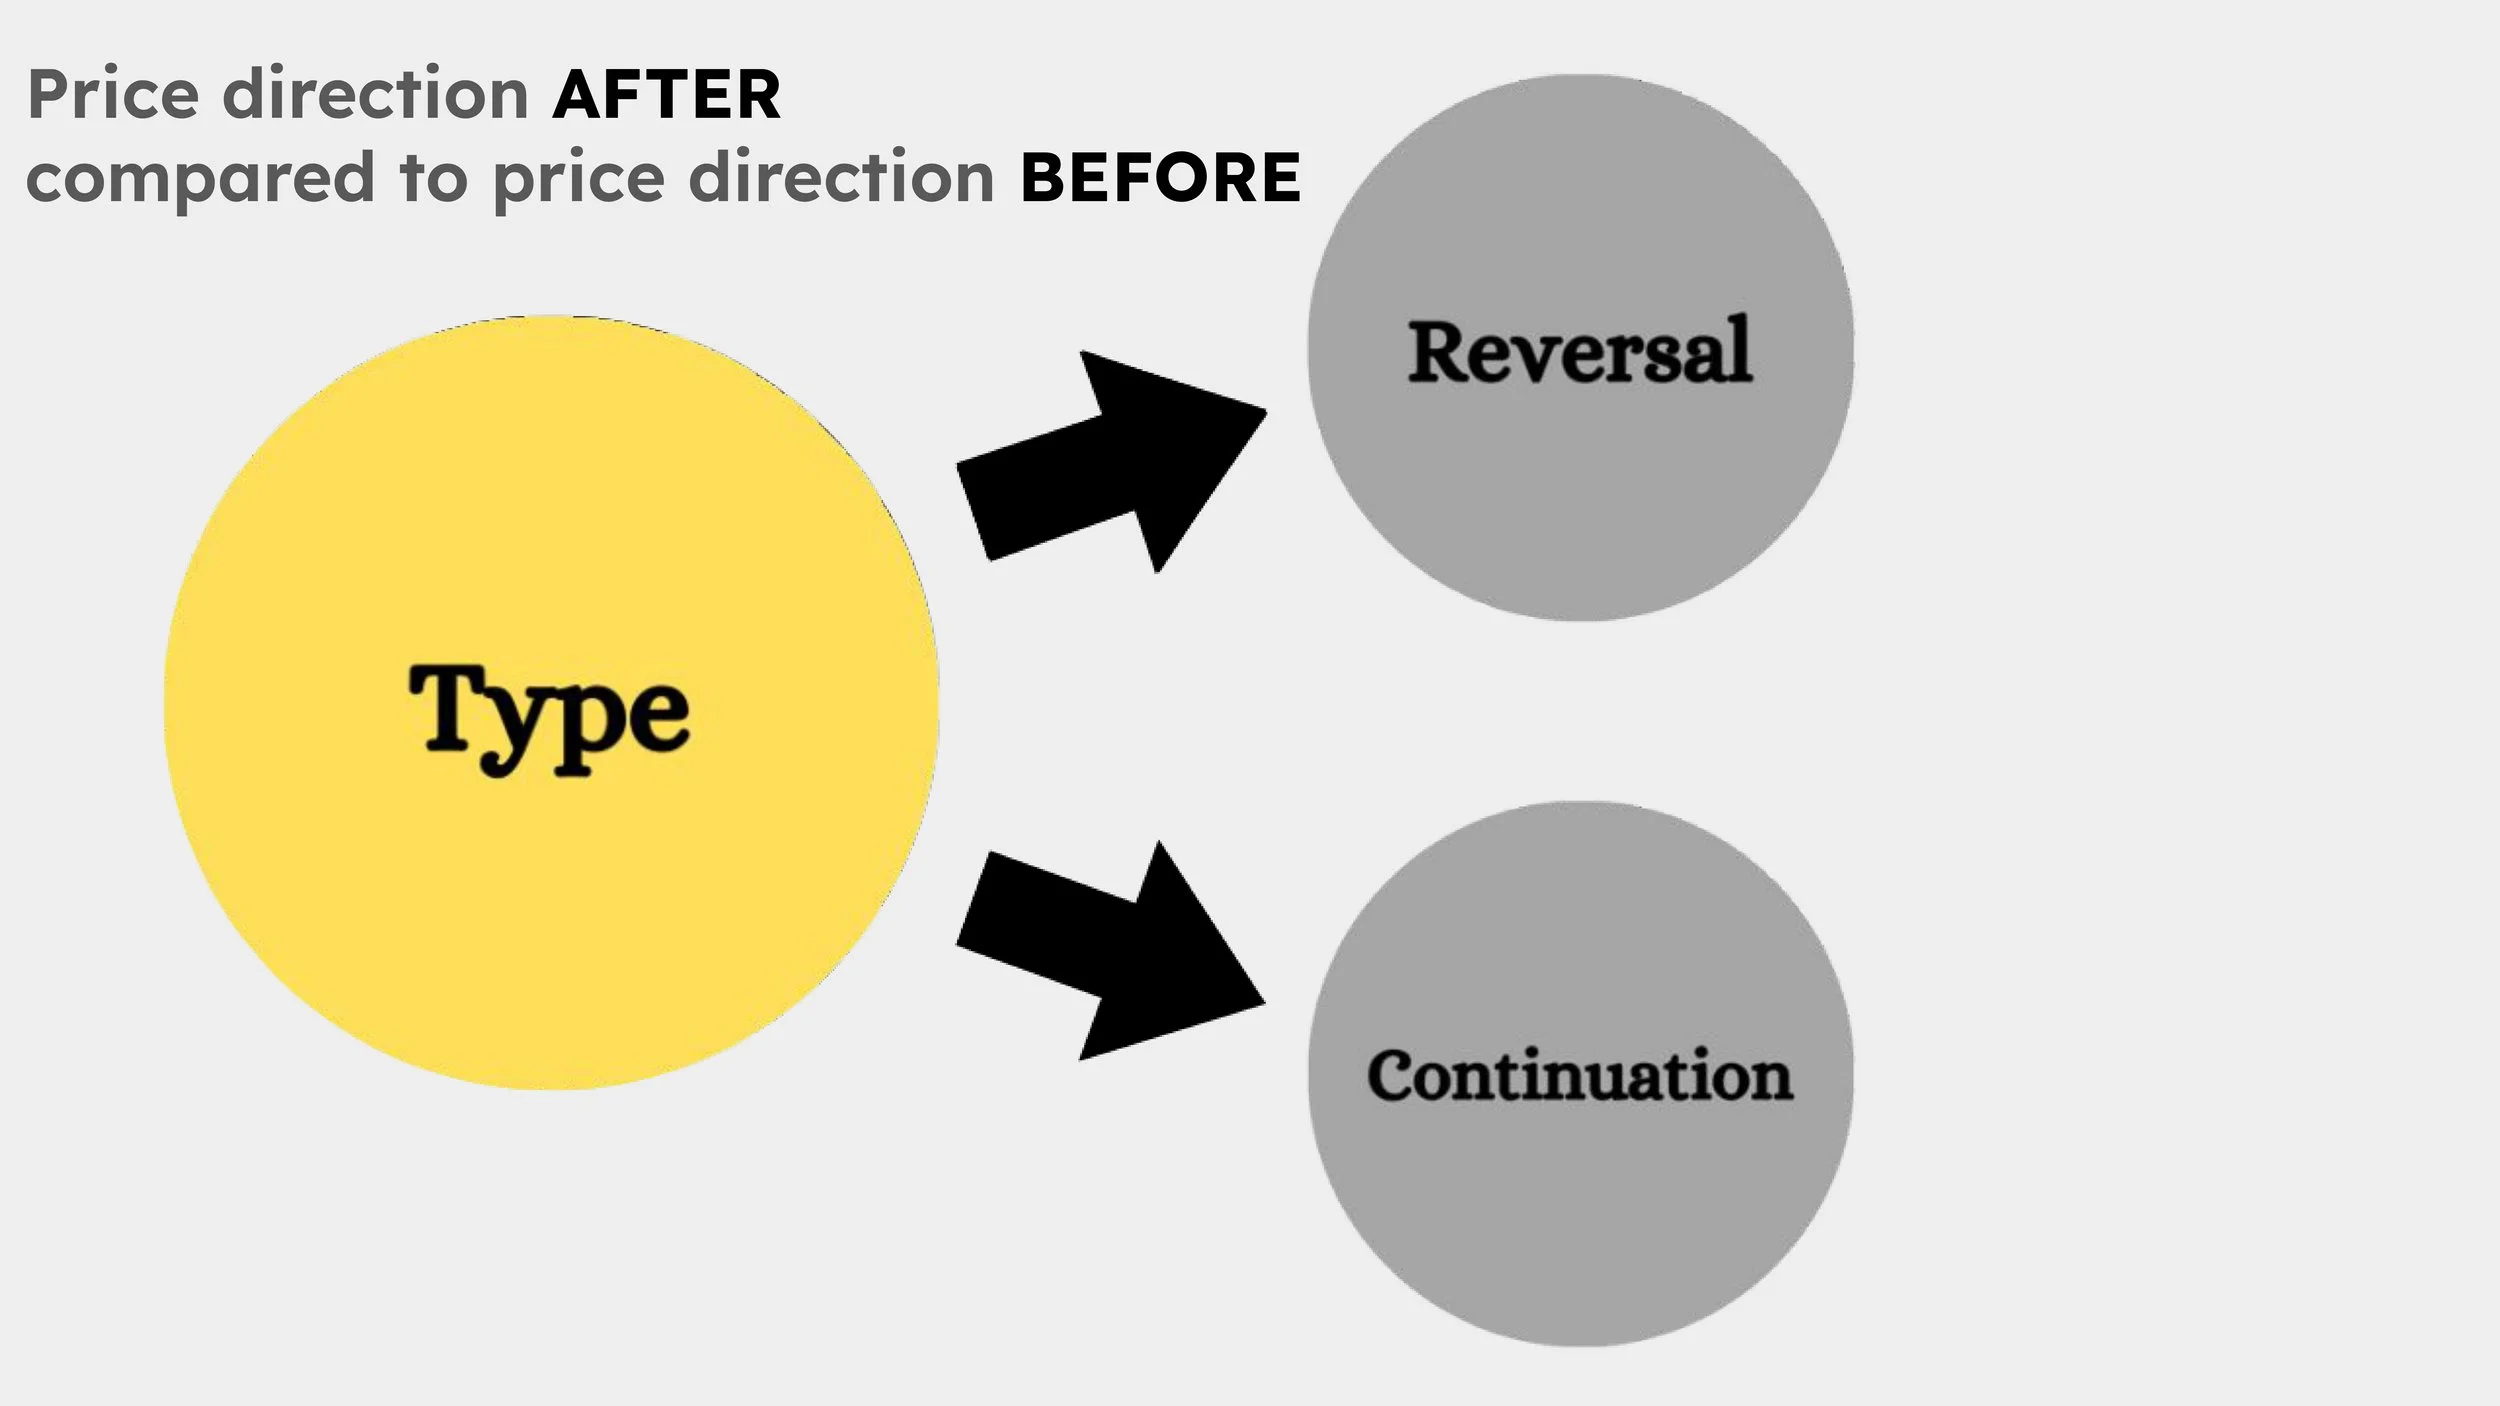
The type of a chart pattern can be classified as reversal, continuation, or uncertain. It describes how the price direction after the pattern compares to the price direction before the pattern formed.
In-Depth Look at Key Chart Patterns
In this section, we take a deep dive into the most important chart patterns. We will explain how to identify each pattern, discuss the underlying logic and psychology, and offer practical trading strategies along with risk management techniques.
Double Bottom Pattern
The double bottom is one of the most reliable bullish reversal patterns. It typically appears after an extended downtrend and signals that the selling pressure is subsiding.
How to Identify a Double Bottom
Preceding Downtrend: The pattern forms after a sustained decline, making the reversal more significant.
Two Similar Lows: The chart will display two lows that are roughly at the same price level. These lows should be separated by a modest peak.
Intervening Peak: The peak between the two lows forms a resistance level that the price must break through to confirm the reversal.
Trading Strategy for a Double Bottom
Entry:
Breakout Entry: Once the price breaks above the intervening peak (the resistance level), consider entering a long position.
Alternate Entry: Some traders prefer entering when the price dips slightly below the initial bounce level and then quickly reverses.
Stop Loss: Place your stop loss just below the lowest point of the pattern to limit potential losses.
Target: A common approach is to aim for a risk-to-reward ratio of 1:2. Measure the distance from your entry point to the stop loss and set your target at least twice that distance.
The double bottom pattern is especially useful for identifying opportunities in various markets, including stocks, forex, and crypto.

The Double Bottom Pattern is a bullish reversal pattern.
Double Top Pattern
The double top is the bearish counterpart to the double bottom and signals that an uptrend may be nearing its end.
How to Identify a Double Top
Preceding Uptrend: The pattern forms after a significant rise, suggesting that buyers may be running out of steam.
Two Similar Highs: Look for two peaks at similar price levels separated by a moderate trough.
Intervening Trough: The trough between the two highs acts as a support level. When the price falls below this support, the reversal is confirmed.
Trading Strategy for a Double Top
Entry:
Enter a short position when the price breaks below the support level formed by the trough.
Stop Loss: Place your stop loss just above the higher of the two peaks.
Target: Using a 2:1 risk-to-reward ratio or measuring the distance from the trough to the peaks can help project a reasonable target.
The double top pattern is a clear signal for traders to consider shorting the market, particularly when combined with other indicators.

The Double Top Chart Pattern is a bearish reversal pattern.
Bull Flag Pattern
The bull flag is one of the most popular continuation patterns used by traders to capture quick profits during an uptrend. It signals a brief consolidation before the price resumes its upward trajectory.
How to Identify a Bull Flag
Impulsive Upward Move: A strong, fast-moving upward price move precedes the formation of the flag.
Consolidation Phase: After the initial impulsive move, the price consolidates in a narrow range, forming a flag-like shape.
Trend Resumption: The breakout from the consolidation area indicates that the uptrend will continue.
Trading Strategy for a Bull Flag
Entry:
Enter the trade on a breakout above the consolidation range.
Alternatively, wait for a slight pullback to the support level of the flag before entering.
Stop Loss: Set your stop loss just below the lowest point of the consolidation area.
Target: Measure the height of the initial impulsive move and project that distance upward from the breakout point. A risk-to-reward ratio of at least 1:2 is advisable.
Bull flag patterns work effectively in markets that exhibit strong momentum, making them particularly popular among day traders and swing traders alike.

The Bull Flag Pattern is a bullish continuation chart pattern and one of my favorite price patterns due to its simplicity and frequent appearance.
Bear Flag Pattern
The bear flag is the bearish equivalent of the bull flag. It occurs during a downtrend and signals a brief consolidation before the price continues its decline.
How to Identify a Bear Flag
Strong Downward Move: The formation starts with a sharp, impulsive decline.
Consolidation: The price then consolidates in a tight range that resembles a flag, often with a slight upward drift.
Downward Continuation: A breakdown from the consolidation area confirms that the downtrend is likely to continue.
Trading Strategy for a Bear Flag
Entry:
Enter a short position as soon as the price breaks below the consolidation area.
Stop Loss: Place your stop loss just above the highest point within the flag.
Target: Determine your target by measuring the initial down move or by maintaining a risk-to-reward ratio of at least 1:2.
The bear flag is a reliable pattern for traders who specialize in selling short, particularly in markets like forex and cryptocurrencies.

The Bear Flag Pattern is a straightforward bearish continuation formation that I also truly appreciate for its clear structure and frequent occurrence in the market.
Head and Shoulders Pattern
The head and shoulders pattern is one of the most iconic reversal patterns in technical analysis. It signals that an uptrend is losing momentum and that a reversal to the downside is likely.
How to Identify a Head and Shoulders Pattern
Left Shoulder: The formation begins with a peak, which marks the end of an uptrend.
Head: This is followed by a higher peak (the head), indicating a temporary continuation of the uptrend before a reversal.
Right Shoulder: A subsequent, lower peak forms near the level of the left shoulder.
Neckline: Draw a trendline connecting the lows between the peaks. This line serves as a key support level.
Trading Strategy for a Head and Shoulders Pattern
Entry:
Consider entering a short position when the price breaks below the neckline. Some traders prefer to wait for a retest of the neckline (which should now act as resistance) before entering.
Stop Loss: Set your stop loss just above the right shoulder.
Target: Measure the vertical distance from the head to the neckline and project that distance downward from the breakout point. A risk-to-reward ratio of at least 1:2 is commonly used.
The head and shoulders pattern is widely respected for its reliability, making it a favorite among professional traders.

The Head and Shoulders Pattern is a classic bearish reversal formation. It is a big chart pattern that often signals a major downturn in price.
Inverse Head and Shoulders Pattern
The inverse head and shoulders pattern is the mirror image of the head and shoulders. It signals a reversal from a downtrend to an uptrend.
How to Identify an Inverse Head and Shoulders Pattern
Left Shoulder: The pattern begins with a low point during a downtrend.
Head: A lower low forms next, representing the head.
Right Shoulder: The price then forms a higher low, roughly similar to the left shoulder.
Neckline: Draw a support line connecting the highs between the lows. This line is crucial for confirming the pattern.
Trading Strategy for an Inverse Head and Shoulders Pattern
Entry:
Enter a long position when the price breaks above the neckline. Some traders wait for a retest of the neckline (now acting as support) before committing.
Stop Loss: Place your stop loss just below the lowest point of the pattern.
Target: Measure the distance from the head to the neckline and project that distance upward from the breakout, or use a minimum risk-to-reward ratio of 1:2.
This pattern is particularly effective for traders looking to capitalize on bullish reversals after a sustained downtrend.

The Inverse Head and Shoulders Pattern is a classic bullish reversal formation. It is a distinctive chart pattern that signals a potential shift from a downtrend to an uptrend.
Get your bonus, free trial, and enjoy automated pattern detection with TradingView Premium.
Falling Wedge Pattern
The falling wedge pattern is unique because it can signal either a reversal or a continuation, depending on the context in which it appears. In a downtrend, it is usually considered a bullish reversal pattern; in an uptrend, it can indicate a continuation.
How to Identify a Falling Wedge
Converging Trendlines: The pattern is characterized by lower highs and lower lows, with the slope of the highs being steeper than that of the lows.
Narrowing Price Range: As the pattern develops, the price consolidates within a tightening range, signaling potential reversal.
Trading Strategy for a Falling Wedge
Entry:
Look for a breakout above the upper trendline. Enter on a strong, confirming candle that indicates momentum is shifting.
Stop Loss: Place the stop loss below the lowest point of the wedge.
Target: Measure the height of the wedge and project that distance upward from the breakout level, or use a 1:2 risk-to-reward ratio.
Falling wedge patterns are especially popular among traders who look for early signals of a bullish reversal in a bearish market.

The Falling Wedge Chart Pattern is unique because it can function as both a reversal and a continuation pattern, and in both cases, it signals a bullish trend direction.
Rising Wedge Pattern
The rising wedge pattern, in contrast, is typically a bearish formation when it appears after an uptrend, though it can occasionally signal a continuation in a downtrend.
How to Identify a Rising Wedge
Converging Trendlines: In this pattern, both higher highs and higher lows are observed, with the upper trendline rising more slowly than the lower one.
Tightening Range: The pattern’s range narrows as time passes, creating a wedge shape that suggests the uptrend is losing momentum.
Trading Strategy for a Rising Wedge
Entry:
Consider entering a short position when the price breaks below the lower trendline, particularly if a strong bearish candle confirms the breakdown.
Stop Loss: Set your stop loss above the highest point of the wedge.
Target: Use the height of the wedge as a guide to set your target level downward, or maintain a risk-to-reward ratio of at least 1:2.
Rising wedge patterns are valuable for traders looking to short the market after an extended uptrend.

The Rising Wedge Chart Pattern is special as it can function as both a reversal and a continuation pattern. In either case, the Rising Wedge typically signals a bearish trend.
Symmetrical Triangle Pattern
The symmetrical triangle is a classic pattern found in many charts, often representing a period of consolidation before the next move. Although it is typically classified as a continuation pattern, the breakout direction may be uncertain until confirmed.
How to Identify a Symmetrical Triangle
Converging Trendlines: The pattern forms when the price makes lower highs and higher lows, resulting in converging trendlines.
Balanced Shape: Ideally, the trendlines are nearly symmetrical, although real-market examples often have slight irregularities.
Trading Strategy for a Symmetrical Triangle
Entry:
Wait for a clear breakout from the triangle. Many traders choose to enter on the candle that closes outside of the triangle’s boundary.
Some traders may also opt for a pullback entry after a false breakout, once the new direction is confirmed.
Stop Loss: Place your stop loss just outside the triangle to protect against false breakouts.
Target: Use the width of the triangle’s base as a measured move to project your target, or set a risk-to-reward ratio of at least 1:2.
Due to the uncertainty associated with symmetrical triangles, using additional indicators for confirmation is often recommended.

The Symmetrical Triangle Chart Pattern can be challenging because its breakout direction is often unpredictable. Personally, I tend to avoid trading this pattern.
Broadening Range Pattern
The broadening range pattern is one of the more challenging formations to trade due to its inherently uncertain nature. This pattern is characterized by diverging trendlines and increasing volatility.
How to Identify a Broadening Range
Diverging Trendlines: In this pattern, the highs continue to rise while the lows continue to fall, creating a fan or megaphone shape.
Increasing Volatility: The widening price range reflects heightened market uncertainty and momentum.
Trading Strategy for a Broadening Range
Caution:
Many traders prefer to avoid trading broadening ranges due to their unpredictable nature.
If you do choose to trade, look for a decisive breakout or breakdown and confirm with volume and momentum.
Entry & Stop Loss:
Enter when the price breaks clearly above or below the pattern.
Place your stop loss above the upper trendline (if shorting) or below the lower trendline (if going long).
Target: Because false signals are common, a strict risk-to-reward ratio (such as 1:2) is recommended.
The broadening range pattern serves as a reminder to exercise caution in highly volatile market conditions.

The Broadening Range Pattern, also known as the Megaphone Pattern or Broadening Formation, features diverging trendlines and increasing price volatility, highlighting growing market uncertainty. The pattern is uncertain, and therefore, hard to trade.
Cup and Handle Pattern
The cup and handle pattern is widely recognized for its bullish implications. Although it generally signals a continuation of the uptrend, it can sometimes act as a reversal pattern.
How to Identify a Cup and Handle
Cup Formation: The cup resembles a U-shaped curve, indicating a period of consolidation after a downtrend or pullback.
Handle Formation: After the cup, the price forms a small consolidation or pullback (the handle) before a breakout.
Breakout: A decisive move above the resistance level (the rim of the cup) signals the continuation of the uptrend.
Trading Strategy for a Cup and Handle
Entry:
Enter a long position when the price breaks above the handle.
Alternatively, consider entering on a retest of the newly formed support level.
Stop Loss: Place your stop loss just below the lowest point of the handle.
Target: Project your target by measuring the depth of the cup or by employing a risk-to-reward ratio of 1:2 or greater.
This pattern is particularly effective in markets with strong momentum and is a favorite among advanced traders.

The Cup and Handle Pattern is a large bullish continuation formation that typically signals the continuation of an uptrend, though in some cases it can also act as a reversal pattern.
Reverse Cup and Handle Pattern
The reverse cup and handle pattern is the bearish equivalent of the traditional cup and handle, indicating that an uptrend is likely to reverse.
How to Identify a Reverse Cup and Handle
Cup Formation: The pattern forms with a U-shaped curve at the top of an uptrend, indicating that prices may have peaked.
Handle Formation: A period of consolidation (the handle) follows the cup, often featuring a rising wedge formation or a tightening range.
Breakdown: The pattern is confirmed when the price breaks below the support level (the rim of the cup).
Trading Strategy for a Reverse Cup and Handle
Entry:
Enter a short position when the price breaks down from the handle.
Stop Loss: Place your stop loss just above the high of the handle.
Target: Measure the height of the cup to determine your target level or use a risk-to-reward ratio of at least 1:2.
This pattern is useful for traders who want to capitalize on bearish reversals following a prolonged uptrend.

The Inverse Cup and Handle Pattern, sometimes called the Inverted Cup and Handle, is a large, typically bearish continuation formation that occurs during a downtrend. It features an inverted cup shape followed by a brief consolidation phase (the handle), indicating that sellers remain in control and the downtrend is likely to continue.
Ascending Triangle Pattern
The ascending triangle is one of the most reliable bullish continuation patterns. It is characterized by a horizontal resistance line and rising support levels.
How to Identify an Ascending Triangle
Uptrend Precursor: The market is typically in an uptrend before the pattern forms.
Horizontal Resistance: Multiple tests of the same resistance level occur, creating a clear horizontal line.
Rising Lows: The lows gradually rise, indicating increased buying pressure.
Trading Strategy for an Ascending Triangle
Entry:
Enter a long position when the price breaks above the horizontal resistance line.
Stop Loss: Place your stop loss just below the most recent higher low.
Target: Use the vertical distance between the resistance line and the support line as a measured move, or maintain a risk-to-reward ratio of 1:2.
Ascending triangles are favored by traders for their clarity and reliability, especially in trending markets.

The Ascending Triangle Pattern is a bullish continuation formation that clearly indicates increasing buying pressure in an established uptrend. It's one of my favorite chart patterns due to its clarity and reliability.
Descending Triangle Pattern
The descending triangle is essentially the bearish counterpart to the ascending triangle. It signals that the downtrend is likely to continue after a period of consolidation.
How to Identify a Descending Triangle
Downtrend Precursor: The market is in a downtrend when this pattern forms.
Horizontal Support: The support level remains relatively flat, even as the highs continue to decline.
Falling Highs: The upper trendline slopes downward, indicating increasing selling pressure.
Trading Strategy for a Descending Triangle
Entry:
Enter a short position when the price breaks below the horizontal support level.
Alternatively, wait for a pullback after the initial breakdown for added confirmation.
Stop Loss: Place your stop loss just above the most recent lower high.
Target: Measure the distance from the support level to the high or set a risk-to-reward ratio of at least 1:2.
Descending triangles offer a clear setup for traders looking to sell into a weakening market.

The Descending Triangle Pattern is a bearish continuation formation that clearly indicates mounting selling pressure within an established downtrend. It forms as the price repeatedly tests a horizontal support level while making lower highs, signaling that the downtrend is likely to persist. I favor this pattern for its clear structure and reliable indication of continued bearish momentum.
Trading Strategies and Tips for Chart Pattern Trading
Beyond simply identifying chart patterns, successful trading lies in the implementation of effective strategies and disciplined risk management. Here are some practical tips to enhance your chart pattern trading approach:
Breakout Versus Pullback Entries
Breakout Entries:
Enter trades when the price decisively breaks through a key support or resistance level.
Ensure that the breakout is supported by increased volume and strong momentum to reduce the likelihood of a false signal.
Pullback Entries:
Alternatively, wait for the price to retrace slightly after the initial breakout.
This strategy often results in a better risk/reward setup by providing a tighter entry and stop-loss placement.
Stop Loss and Risk Management
Proper Stop Loss Placement:
Use the structure of the pattern to set your stop loss. For instance, place it below the bottom of a double bottom or above the top of a double top.
Risk-to-Reward Ratio:
Aim for a minimum risk-to-reward ratio of 1:2. This means that the potential profit should be at least twice the amount you risk on the trade.
Adjusting Positions:
As your trade moves in your favor, consider trailing your stop loss to lock in profits.
Confirmation with Volume and Momentum
Volume Analysis:
Confirm breakouts with increased trading volume, which adds validity to the pattern.
Momentum Indicators:
Use additional indicators such as RSI or MACD to further confirm the strength of the move before entering a trade.
Continuous Learning and Practice
Backtesting:
Review past charts and practice identifying patterns to build confidence and refine your approach.
Simulated Trading:
Consider practicing with a demo account to gain practical experience before committing real capital.
Keep a Trading Journal:
Document your trades, including your rationale and outcome. This helps in identifying strengths and areas for improvement.
Adapting to Market Conditions
Flexibility:
Not every chart pattern will play out perfectly. Adjust your strategy based on the market’s unique characteristics and current volatility.
Combining Patterns:
In many cases, chart patterns work best when combined with other technical analysis tools. For example, using trendlines, support/resistance levels, and candlestick patterns can help refine entry and exit decisions.
Psychology and Patience
Discipline:
Stick to your trading plan and avoid chasing trades outside your strategy.
Patience:
Allow patterns to fully develop before making your move. Rushing in too early can lead to poor risk management and potential losses.
By following these strategies and continually refining your approach, you can become more consistent and successful in your chart pattern trading.
Get your bonus, free trial, and enjoy automated pattern detection with TradingView Premium.
Final Thoughts: Mastering Chart Pattern Trading
Chart pattern trading is both an art and a science. When you understand the technical aspects behind each formation and the psychology that drives market behavior, you are in a far better position to make informed trading decisions. Whether you’re working with a double bottom pattern, a head and shoulders formation, or any other chart pattern, the key to success lies in continuous practice, disciplined risk management, and an adaptive strategy.
This guide has provided you with an in-depth look at a wide variety of chart patterns—from the bullish double bottom and ascending triangle patterns to the bearish double top, head and shoulders, and descending triangle patterns. Each pattern offers unique insights into market behavior, and when applied correctly, they can significantly improve your trading performance across different financial markets, including stocks, forex, and cryptocurrencies.
Remember that no strategy is foolproof, and not every pattern will result in a successful trade. The goal is to use these patterns as tools in your overall trading toolkit—combined with other forms of technical and fundamental analysis—to help you make smarter, more informed decisions.
If you’re new to chart pattern trading, start by practicing on historical charts and gradually move into live trading once you’re confident in your ability to read and react to these patterns. With time, patience, and continuous learning, you will develop the discipline and insight needed to navigate even the most challenging markets.
We hope you find this comprehensive chart pattern trading course valuable. By integrating these concepts into your trading routine, you’ll be well on your way to mastering technical analysis and achieving consistent profitability.
Happy Trading, and may your charts always guide you to success!
AI & Smart Money Trading Strategies (LIMITED TIME: Save 70% Today!)
$15 Bonus & 30-Day Free Premium
Trade Crypto - Up To $30,000 Bonus
Bonus Content, Emojis, Priority Replies & More
Trade Crypto - 10% Off Trading Fees
Trade Crypto - Start Your Journey
Sign Up for Exclusive Trading Insights
Explore More Trading Content
Join Our Trading Community