
The Doji Candlestick Pattern: Dragonfly, Gravestone, Long-Legged and Four Price Doji
Master the different types of Doji patterns and learn when they signal potential market reversals.
Last Updated: April 20, 2025
Candlestick charts display key price information (open, high, low, close) in a single visual element, making them essential for effective technical analysis across all trading markets.
Green/white candles (bullish) indicate price increases during the time period, while red/black candles (bearish) show price decreases - the body size reveals the strength of the move.
Candlestick patterns like the Hammer, Doji, Engulfing patterns, and Shooting Star can signal potential market reversals or continuations when interpreted in the proper context.
Candlestick wicks (shadows) reveal price extremes during the trading period, with long wicks indicating strong rejection of prices and potential reversal zones.
For effective candlestick analysis, always consider the overall market context, use multiple timeframes, and combine patterns with other technical indicators for confirmation.
Candlestick charts are a cornerstone of technical analysis, providing traders with a visual representation of price action over specific time frames. If you're new to trading, understanding candlesticks is essential for analyzing the stock market, forex, or cryptocurrencies. In this guide, we’ll break down everything you need to know about how to read candlestick charts, even if you have zero experience. By the end, you’ll be able to interpret candlestick patterns and use them to inform your trading strategies.
Learn how to read candlestick charts and understand candlestick patterns with this beginner-friendly video guide.
Instantly identify over 30 candlestick patterns across any chart with built-in pattern recognition indicators.
Set up custom alerts that notify you when specific candlestick patterns form on your favorite assets.
Analyze candlestick patterns across multiple timeframes simultaneously to confirm trading signals.
Test the historical performance of specific candlestick patterns to validate their effectiveness.
Special offer: Get 30 days of free premium access with our exclusive link.
TradingView offers several powerful tools specifically designed to help traders identify and trade candlestick patterns:
The platform automatically detects common candlestick patterns including:
Access a library of community-created indicators specifically designed for candlestick pattern traders, or create your own custom pattern detection tools using Pine Script.
Customize your candlestick visualization with options for Heikin Ashi, Hollow Candles, and other specialized chart types that help identify trends and patterns more clearly.
Candlestick charts are a type of financial chart used to describe price movements of an asset over time. Each candlestick represents a specific time period, such as one minute, one hour, one day, or even one month. These charts are popular because they show a lot of information at a glance, including the asset's opening price, closing price, highest price, and lowest price during the selected time frame.

Example of a Bitcoin Candlestick Chart showcasing bullish candles (green) and bearish candles (red).
There are two primary types of candlesticks:
Bullish Candles (Green or White): Indicate that the price has increased during the time frame. The opening price is lower than the closing price.
Bearish Candles (Red or Black): Indicate that the price has decreased during the time frame. The opening price is higher than the closing price.
Each candlestick represents a specific time period. For example:
1-Minute Candle: Represents one minute of price movement.
1-Hour Candle: Represents one hour of price movement.
1-Day Candle: Represents one day of price movement.
Traders can select time frames based on their trading style. For instance, day traders often use 1-minute or 5-minute charts, while swing traders may prefer daily or weekly charts.
Each candlestick has four key components:
Open: The price at the beginning of the time frame.
Close: The price at the end of the time frame.
High: The highest price reached during the time frame.
Low: The lowest price reached during the time frame.
These four data points are often abbreviated as OHLC (Open, High, Low, Close).
The body is the thick part of the candlestick and represents the range between the opening and closing prices:
Green Body (Bullish): Closing price is higher than the opening price.
Red Body (Bearish): Closing price is lower than the opening price.
The wicks (or shadows) are the thin lines extending above and below the body. They represent the high and low prices during the time frame.
Upper Wick: Shows the highest price.
Lower Wick: Shows the lowest price.
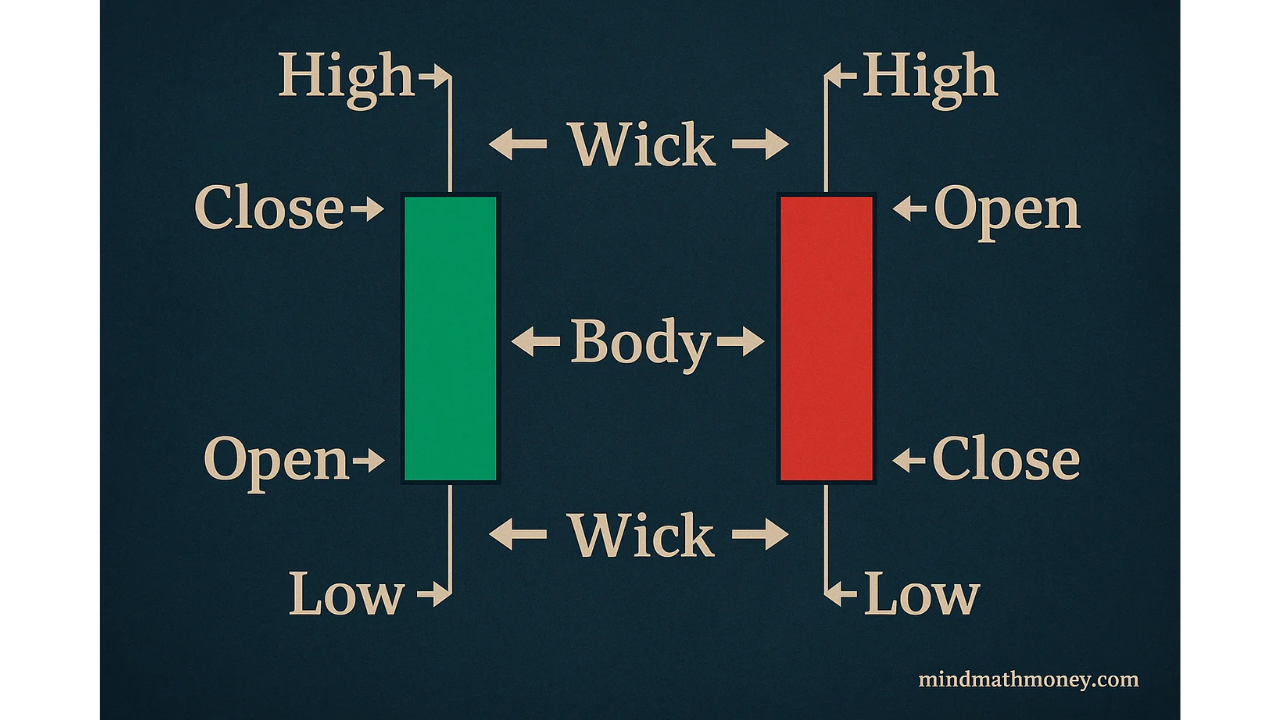
How to Read Candlesticks: This image explains bullish and bearish candles, highlighting their open, high, low, and close prices. It also illustrates candlestick bodies and wicks.
Candlestick patterns help traders identify potential market trends and reversals. Here are some key patterns to know:
A hammer is a bullish reversal pattern that forms after a downtrend. It has:
A small body.
A long lower wick.
Little to no upper wick.
This pattern indicates that buyers pushed the price higher after significant selling pressure.

Hammer Candlestick Pattern: This image illustrates the Hammer pattern, a bullish reversal signal with a small body and long lower wick. It shows how the pattern forms after a downtrend, indicating strong buying pressure and a potential trend reversal in trading.
A Doji occurs when the opening and closing prices are nearly identical, resulting in a very small body:
Indicates indecision in the market.
Can signal a potential reversal or continuation, depending on context.

Doji Candlestick Pattern: This image explains the Doji pattern, characterized by a small or non-existent body and equal high and low wicks. It highlights market indecision and its role in predicting potential reversals or continuation in trading.
Bullish Engulfing: A green candle completely "engulfs" the body of the previous red candle, signaling potential upward momentum.
Bearish Engulfing: A red candle engulfs the previous green candle, signaling potential downward momentum.

Engulfing Candlestick Pattern: This image demonstrates the Engulfing pattern, with a bullish engulfing candle that completely covers the previous bearish candle. It explains how this pattern signals a strong potential trend reversal in price action.
A bearish reversal pattern with:
A small body near the low of the candle.
A long upper wick.
This indicates that sellers took control after buyers pushed the price higher.

Shooting Star Candlestick Pattern: This image showcases the Shooting Star pattern, a bearish reversal signal with a small body near the low and a long upper wick. It indicates strong selling pressure after an uptrend, warning of a potential price decline.
Momentum refers to the speed or strength of price movement. Traders can gauge momentum by analyzing the size of the candlestick’s body and its wicks:
Long Body: Indicates strong momentum in the direction of the candle.
Short Body with Long Wicks: Indicates indecision or a potential reversal.
Momentum Candle: A candle with a body at least twice the size of previous candles, signaling strong market movement.
Use Context: Always consider candlestick patterns in the context of the overall trend and support/resistance levels.
Combine with Indicators: Tools like Moving Averages, RSI, and MACD can enhance your analysis.
Start with Higher Time Frames: If you’re new, begin with daily charts to get a clear view of market trends.
Practice on Trading Platforms: Platforms like TradingView allow you to explore charts and test your skills.
Candlestick charts and bar charts both display the same price information (open, high, low, close), but candlesticks are more visually intuitive. Candlesticks have a colored "body" that clearly shows the difference between opening and closing prices, making it easier to identify bullish vs bearish movements at a glance. Bar charts use horizontal lines for open/close prices, which can be harder to interpret quickly. Additionally, the colored bodies of candlesticks make patterns more visually apparent, which is why most modern traders prefer candlestick charts.
To identify trends using candlesticks, look for these key indicators: 1) In uptrends, you'll see a series of higher highs and higher lows with predominantly bullish (green/white) candles, often with small lower wicks. 2) In downtrends, you'll observe lower highs and lower lows with mostly bearish (red/black) candles, frequently showing small upper wicks. 3) For potential trend reversals, watch for pattern formations like engulfing patterns, morning/evening stars, or hammers/shooting stars at support/resistance levels. Remember that single candlesticks rarely indicate trends - always analyze multiple candles together and consider the broader market context.
While no pattern is 100% reliable, some of the most consistently effective candlestick patterns include: 1) Engulfing patterns (bullish or bearish) - when a candle completely engulfs the previous one, often signaling strong momentum shift; 2) Morning/Evening Star patterns - three-candle reversal formations that show a clear shift in market sentiment; 3) Hammers and Hanging Man patterns at support levels; 4) Shooting Stars and Inverted Hammers at resistance levels. The reliability increases significantly when these patterns occur at key support/resistance levels, coincide with overbought/oversold indicators, and form on higher timeframes (daily vs hourly). Always use these patterns in conjunction with other technical analysis tools for confirmation.
The best timeframe for candlestick analysis depends on your trading style and goals. For day traders, 1-minute to 1-hour charts are most valuable for timing entries and exits. Swing traders typically use 4-hour, daily, or weekly charts to identify medium-term opportunities. Long-term investors might focus primarily on weekly and monthly candlestick patterns to spot major trend changes. The higher the timeframe, the more significant and reliable the patterns tend to be - a reversal pattern on a weekly chart generally carries more weight than the same pattern on a 5-minute chart. Many experienced traders use multiple timeframes simultaneously, starting with a higher timeframe to identify the overall trend, then moving to lower timeframes for precise entry points.
To practice reading candlestick patterns effectively: 1) Start with a demo account on a platform like TradingView where you can analyze charts without risking real money; 2) Pick one or two patterns to focus on initially (like engulfing patterns or dojis) rather than trying to learn all patterns at once; 3) Use the replay feature available on some platforms to watch how patterns played out historically; 4) Keep a trading journal where you screenshot patterns you've identified and note the outcome; 5) Practice identifying patterns across different timeframes and markets to understand how context affects reliability; 6) Join trading communities or forums where you can discuss pattern identification with other traders; 7) Consider using pattern recognition tools initially as training wheels until you can spot patterns naturally.
Reading candlestick charts is an essential skill for any trader. By understanding candlestick anatomy, patterns, and momentum, you can make better decisions and potentially improve your trading. Remember, mastering candlesticks takes time and practice, so be patient and keep learning.
Master the different types of Doji patterns and learn when they signal potential market reversals.
Learn how to identify key reversal points in the market using swing analysis to find high-probability trading opportunities.
Discover how to automatically detect candlestick patterns and chart formations using TradingView's powerful pattern recognition tools.
Discover how to read the market's language through price movements and candlestick formations for more accurate trading decisions.
I bought my first stock at 16, and since then, financial markets have fascinated me. Understanding how human behavior shapes market structure and price action is both intellectually and financially rewarding.
I’ve always loved teaching—helping people have their “aha moments” is an amazing feeling. That’s why I created Mind Math Money to share insights on trading, technical analysis, and finance.
Over the years, I’ve built a community of over 200,000 YouTube followers, all striving to become better traders. Check out my YouTube channel for more insights and tutorials.