
How to Draw Fibonacci Retracement Correctly in TradingView
Master the precise technique for accurate Fibonacci retracement placement to identify the most reliable support and resistance levels.
Last Updated: March 24, 2025
The Fibonacci Golden Zone lies between the 50% and 61.8% retracement levels and often provides high-probability trading opportunities
To optimize your TradingView Fibonacci settings, focus on the 50%, 61.8%, and 100% levels while removing less significant levels
Visual enhancements like shading the Golden Zone area and using distinctive colors can improve your chart analysis efficiency
Combine Fibonacci retracement with other technical analysis tools for stronger trade confirmation and higher success rates
Look for reversal candlestick patterns when price reaches the Golden Zone to identify optimal entry points with favorable risk-reward ratios
Fibonacci retracement is a powerful tool in technical analysis and is widely used by traders in forex, stocks, and crypto trading to predict significant levels in the market. In this guide, we'll walk you through setting up your Fibonacci retracement tool to highlight the Golden Zone, potentially taking your trading strategy to the next level.
Do you prefer video over text? Click here to learn the Fibonacci Retracement Settings step-by-step.
The Fibonacci Golden Zone refers to the key retracement levels between 50% and 61.8%. These levels are significant because they represent areas where the price is likely to reverse or continue its trend. By focusing on this zone, traders can identify high-probability trading opportunities in the market.
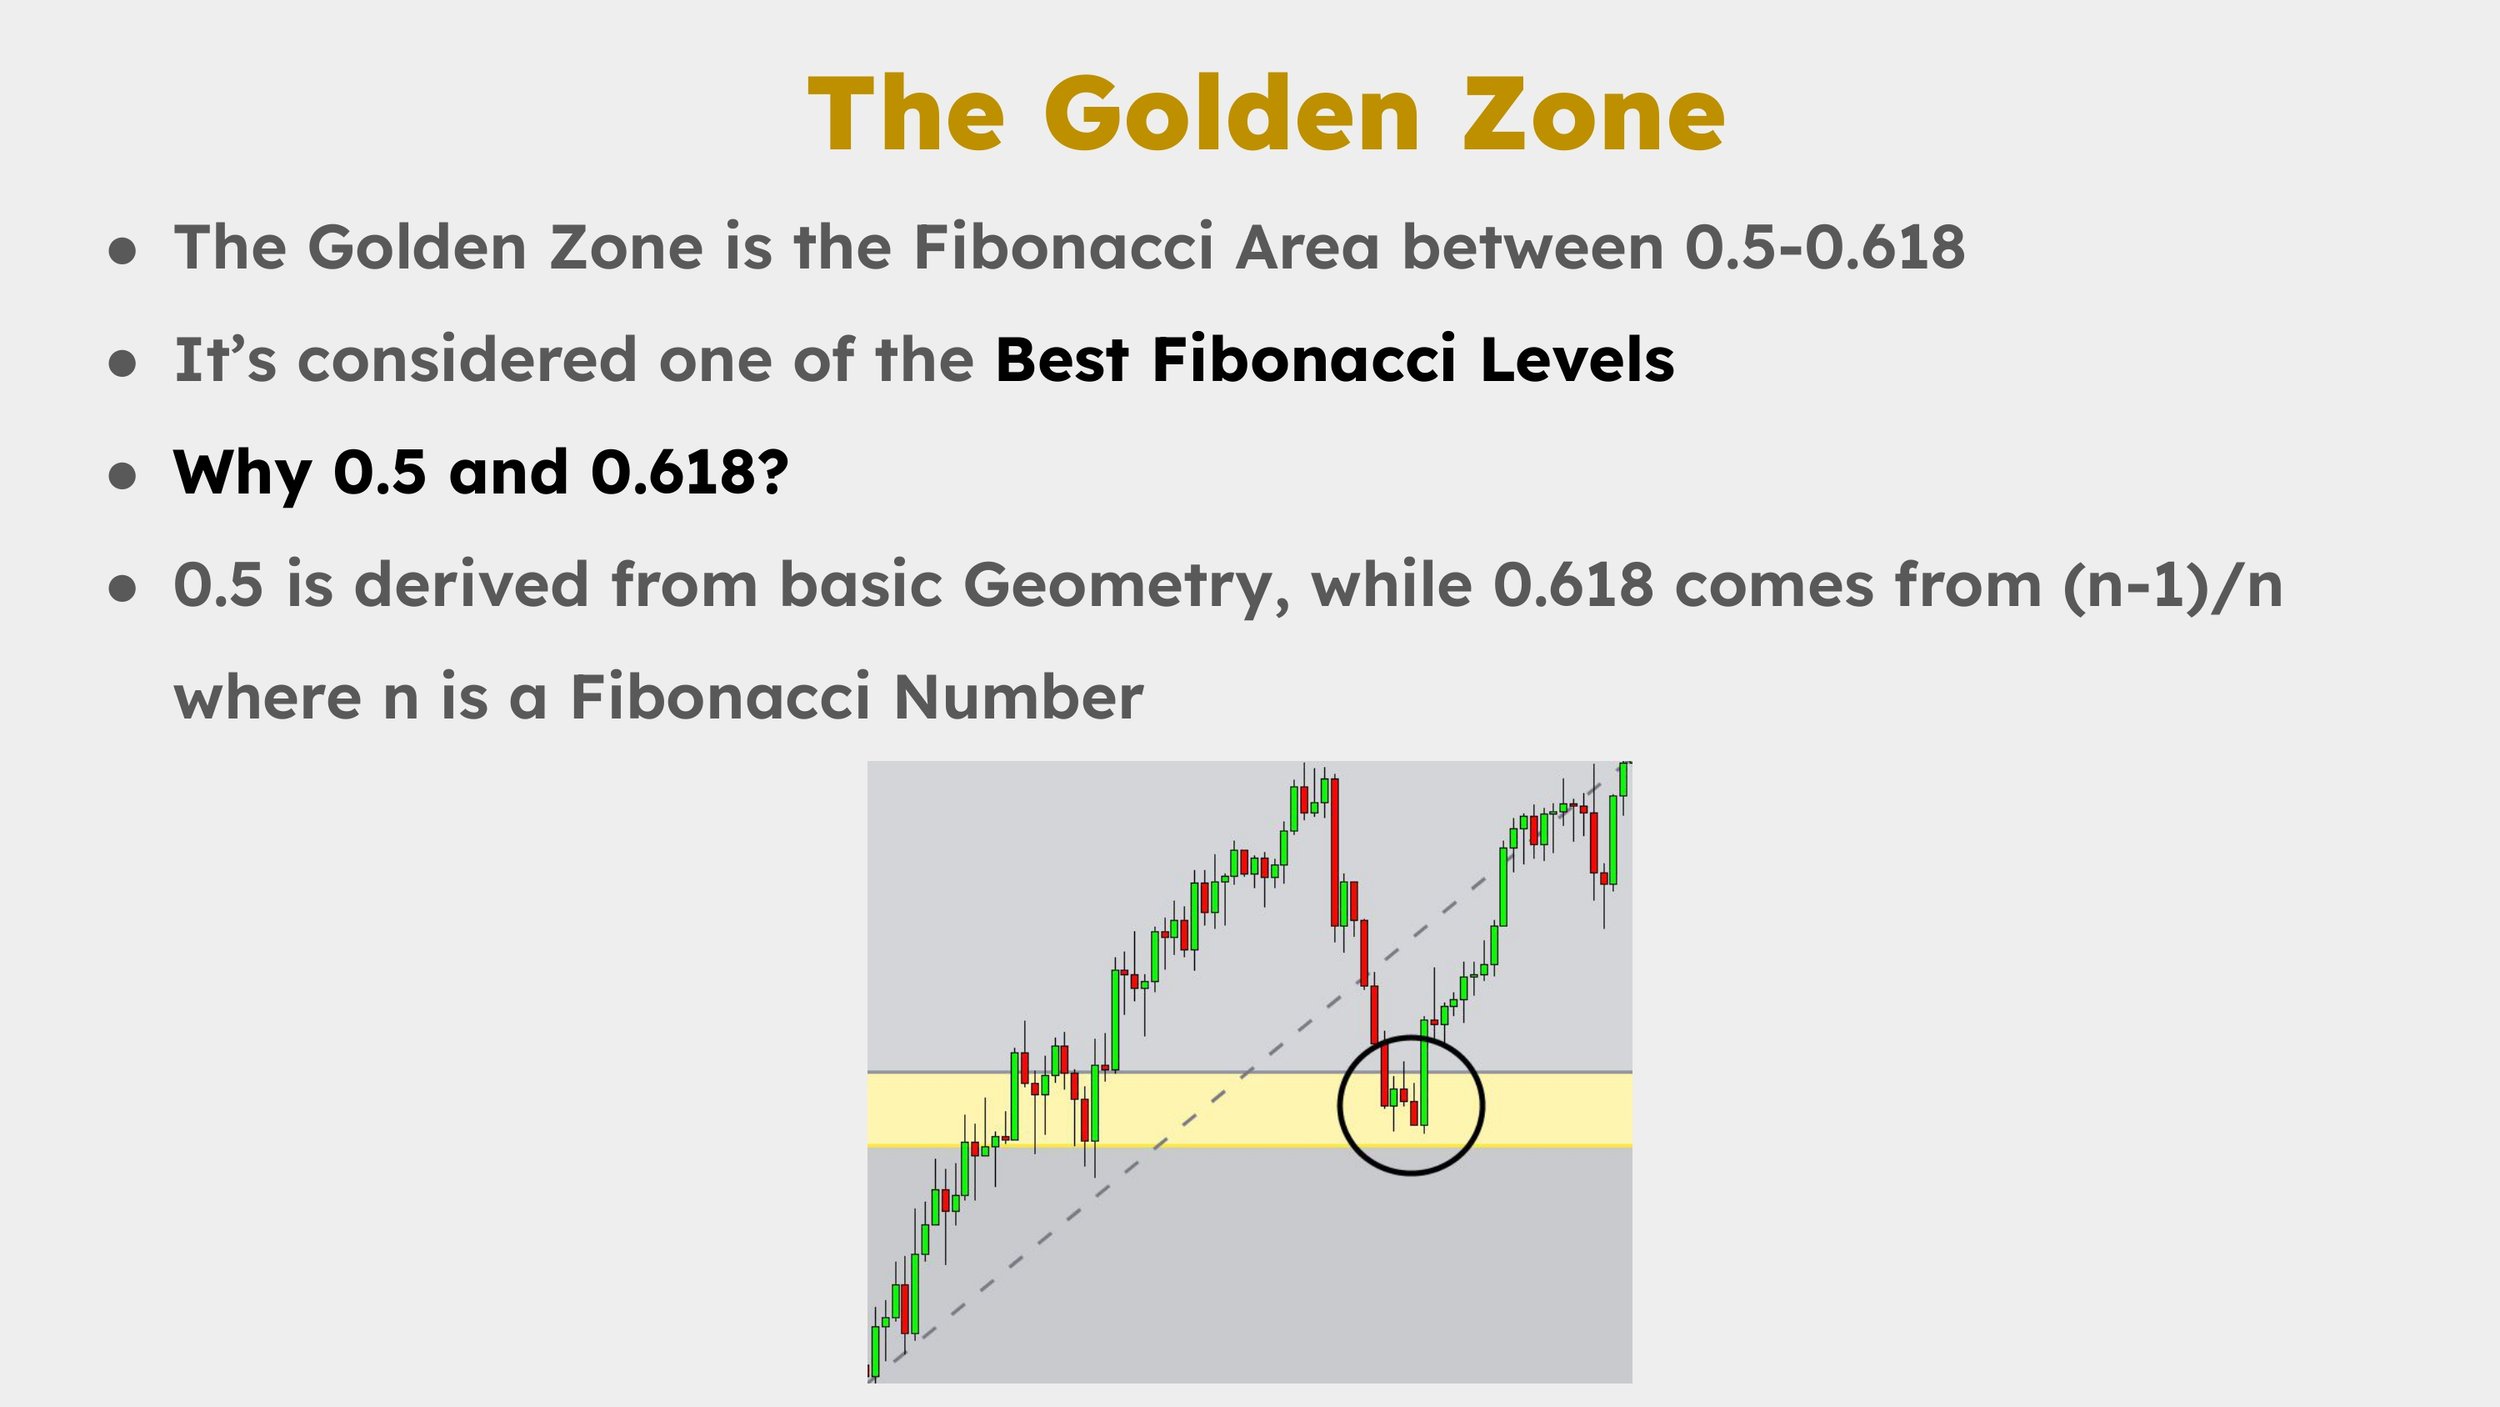
The Fibonacci Golden Zone is the Area between 0.5 and 0.618
Follow these steps to customize your Fibonacci retracement settings and emphasize the Golden Zone on your charts.
Open your charting platform (such as TradingView).
Navigate to the Gann and Fibonacci tools menu.
Select the Fib Retracement tool.

How to open Fibonacci in TradingView
Click on a significant swing low on the chart.
Drag the tool up to a corresponding swing high.
Release the mouse button to apply the Fibonacci levels.
After drawing, a settings window should appear.
If not, right-click on the Fibonacci retracement lines and select Settings.

How to change Fibonacci Settings in TradingView
In the settings, you'll see a list of Fibonacci levels. Adjust them as follows:
Ensure the 0% Level is Checked: This represents your starting point.
Uncheck These Levels:
0.236 (23.6%)
0.382 (38.2%)
0.786 (78.6%)
Any Fibonacci Extensions (levels beyond 100%, such as 1.272 or 1.618)
Keep Key Levels:
0.5 (50%)
0.618 (61.8%)
1.0 (100%)

Fib Retracement Settings: The Golden Zone
To make the Golden Zone stand out:
Change the Color of the 50% Level:
Set it to a neutral color like gray.
Change the Color of the 61.8% Level:
Set it to gold or yellow to represent the Golden Zone.
Adjust the Background:
You can shade the area between the 50% and 61.8% levels.
Adjust the opacity to your preference to highlight the Fibonacci Zone.
Click OK or Apply to save your changes.
Your Fibonacci retracement tool is now set up to emphasize the Golden Zone.

The Fibonacci Golden Zone
With your tool set up, here's how to use the Fibonacci Golden Zone in your trading strategy:
Identify Swing Points: Look for clear swing highs and swing lows in the market.
Draw the Fibonacci Retracement: Apply the tool from the swing low to the swing high in an uptrend (or vice versa in a downtrend).
Analyze Price Action:
Watch how the price behaves as it approaches the Golden Zone.
Look for reversal signals or continuation patterns within this zone.
Execute Your Trade:
If trading forex or any other market, consider entering a position if the price shows signs of reversal in the Golden Zone.
Use proper risk management by setting stop-loss orders below the Golden Zone.
Suppose the price of an asset has risen from a swing low to a swing high and is now retracing:
Draw the Fibonacci Retracement from the swing low to the swing high.
Observe the Golden Zone between the 50% and 61.8% levels.
Look for Entry Signals:
If the price reaches this zone and forms bullish candlestick patterns, it may indicate a buying opportunity.
Manage Your Trade:
Set a stop-loss below the 61.8% level.
Plan your take-profit levels based on Fibonacci extensions or previous resistance levels.
To maximize the effectiveness of the Fibonacci Golden Zone strategy:
Combine with Other Indicators or Techniques:
Use Price Action, Market Structure, or other techniques to confirm signals.
Stay Informed:
Keep an eye on market news and events that may impact price movements.
Practice Discipline:
Stick to your trading plan and risk management rules.
The most significant Fibonacci retracement levels are 0.5 (50%), 0.618 (61.8%), and 1.0 (100%). The area between 50% and 61.8% is known as the Golden Zone and often provides the highest probability trading opportunities. While other levels like 23.6% and 38.2% exist, they typically have less significance in most trading scenarios.
To draw Fibonacci retracement correctly, identify a significant price move (swing low to swing high for uptrends, or swing high to swing low for downtrends). In TradingView, select the Fibonacci Retracement tool, click on the starting point (swing low in uptrends), and drag to the ending point (swing high in uptrends). The tool will automatically calculate and display the retracement levels. Accuracy in selecting the precise swing points is crucial for effective Fibonacci analysis.
Fibonacci retracement can work in various market conditions but is most effective in trending markets with clear swing highs and lows. In ranging or highly volatile markets, Fibonacci levels may be less reliable. For best results, use Fibonacci retracement in conjunction with other technical analysis tools, such as trend identification, support/resistance levels, and candlestick patterns for confirmation.
The area between 50% and 61.8% is called the Golden Zone because it represents a sweet spot where price often reacts. The 61.8% level derives from the Golden Ratio (1.618), which appears throughout nature and mathematics. Traders have observed that prices frequently reverse or show significant reactions when reaching this zone. Historically, these levels have shown high reliability in various market conditions, making them "golden" opportunities for entries.
Yes, Fibonacci extensions can be valuable alongside retracements, especially for setting profit targets. While retracements help identify potential entry points during pullbacks, extensions (like 1.27, 1.618, 2.0) help determine where price might go after continuing its original trend. When used together, they create a comprehensive approach to both entry and exit strategies in Fibonacci-based trading.
Mastering the Fibonacci retracement tool and understanding how to highlight and utilize the Golden Zone can improve your trading performance. However, while Fibonacci can be a powerful tool, it should not be used in isolation. For the best results, combine it with other technical analysis tools and indicators to confirm signals and ensure more reliable trading decisions.
Master the precise technique for accurate Fibonacci retracement placement to identify the most reliable support and resistance levels.
Learn how to implement a complete Fibonacci trading strategy from setup to execution with practical trading examples.
Discover the complete system for trading with Fibonacci, including advanced techniques with retracements, extensions, and time analysis.
Learn how to identify the perfect swing points for your Fibonacci retracement analysis and improve your trading accuracy.
Access advanced Fibonacci drawing tools, multi-timeframe analysis, and custom alerts
Get comprehensive stock data and technical indicators to enhance your trading decisions
Test your Fibonacci Golden Zone strategy in a professional trading environment
I bought my first stock at 16, and since then, financial markets have fascinated me. Understanding how human behavior shapes market structure and price action is both intellectually and financially rewarding.
I’ve always loved teaching—helping people have their “aha moments” is an amazing feeling. That’s why I created Mind Math Money to share insights on trading, technical analysis, and finance.
Over the years, I’ve built a community of over 200,000 YouTube followers, all striving to become better traders. Check out my YouTube channel for more insights and tutorials.