
The RSI Indicator: How to use the RSI Indicator for Trading Crypto, Forex, and Stocks
Learn how to effectively use the Relative Strength Index to identify overbought and oversold conditions.
Last Updated: March 24, 2025
Volume measures trading activity and provides crucial insight into the strength and conviction behind price movements
High volume confirms the significance of price movements, whether bullish or bearish, while low volume suggests weak market participation
Breakouts are more reliable when accompanied by high volume, indicating strong market participation and increased likelihood of continuation
Declining volume during a price trend can signal weakening momentum and potential reversals, serving as an early warning system
For optimal trading results, combine volume analysis with other technical indicators and price action rather than using it in isolation
Understanding how to interpret volume in trading can significantly enhance your market analysis and trading strategies. When combined with price action, volume becomes a powerful tool that can help traders confirm trends, identify potential reversals, and make more informed decisions. In this comprehensive guide, we'll delve deep into the concept of volume in trading, explore how to use the volume indicator, and discuss effective volume trading strategies.
In this video, we dive into volume analysis in trading to help you understand how to read volume and apply it to your strategies.
In simple terms, volume measures the number of stocks, cryptocurrencies, or forex pairs traded during a given time period. It reflects the overall activity and liquidity of a security. For instance:
On a daily chart, each volume bar represents the total number of shares or units traded during that day.
On an hourly chart, each volume bar shows the trading volume for that hour.
On a 5-minute chart, it indicates the number of shares or units traded during those 5 minutes.
Understanding volume is crucial because it provides insight into the strength of a price movement. High volume during a price increase suggests strong buying interest, while high volume during a price decrease indicates significant selling pressure.

What is Volume in Trading? Volume measures the number of stocks, cryptos, or forex pairs traded during a give time period.
The volume indicator is a fundamental tool available on most trading platforms, including TradingView. Here's how you can add and use it:
Open Your Trading Platform: Log in to your TradingView account.
Add the Volume Indicator:
Click on the "Indicators" tab at the top of the chart.
In the search bar, type "Volume."
Select the basic "Volume" indicator from the list.
Interpret the Volume Bars:
The volume bars appear at the bottom of your chart.
Each bar corresponds to the trading volume during the time frame of your chart (daily, hourly, etc.).
Green bars typically indicate higher volume on up days, while red bars show higher volume on down days.
By incorporating the volume indicator into your analysis, you can gauge the level of participation behind price movements.
Volume provides valuable information about the strength and sustainability of price movements. Think of volume as the fuel that drives the market:
High Trading Volume: Indicates strong conviction among traders. A price move supported by high volume is more likely to be sustained.
Low Trading Volume: Suggests weak participation. Price movements on low volume may lack the momentum to continue.
A price action signal is more significant when accompanied by high volume. For example:
Bullish Signal with High Volume: If a bullish candlestick pattern forms on high volume, it suggests strong buying interest, increasing the likelihood of a continued upward move.
Bullish Signal with Low Volume: The same pattern on low volume may indicate a lack of conviction, making the signal less reliable.
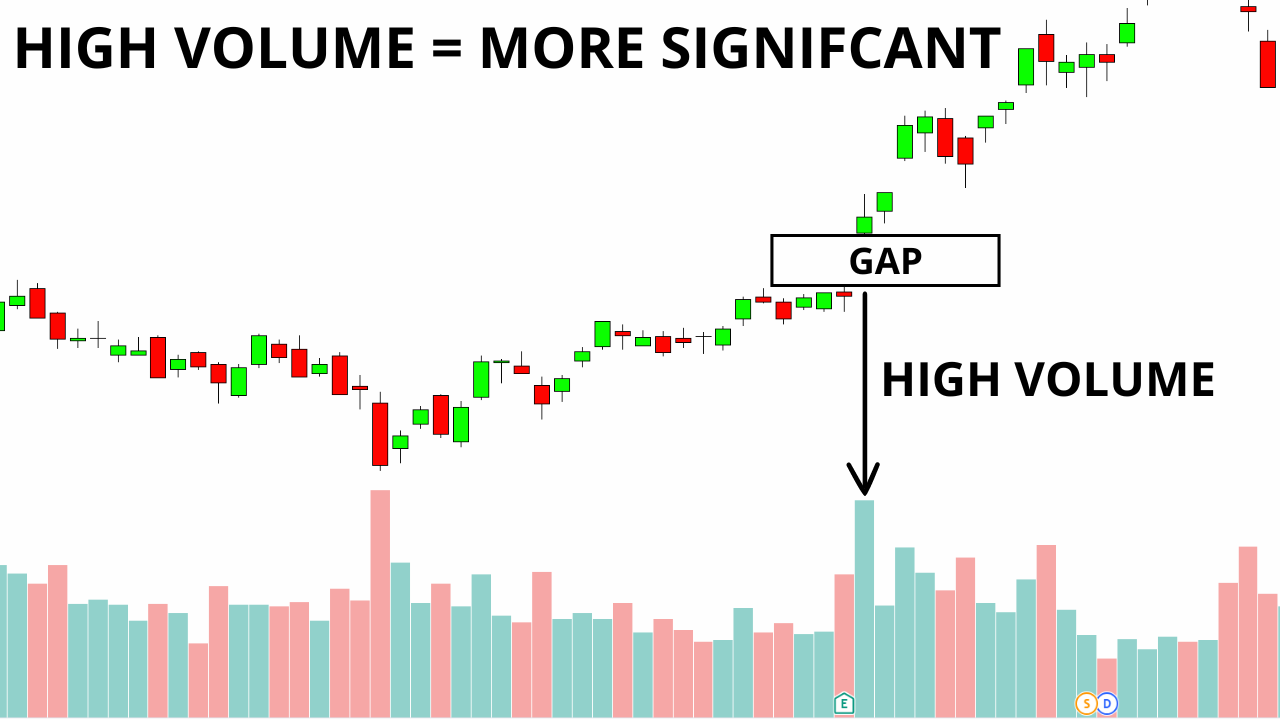
In trading, a price move accompanied by high volume is considered more significant because it indicates strong market participation and validates the strength and reliability of the trend.
Breakouts are more trustworthy when they occur on high volume:
High Volume Breakout:
Signifies that many traders are participating.
Confirms the strength of the breakout.
Suggests the price is likely to continue in the breakout direction.
Low Volume Breakout:
Indicates limited participation.
Raises the possibility of a false breakout.
Suggests caution, as the price may reverse.
Analyzing volume trends can also help you assess the health of a price trend:
Increasing Volume in an Uptrend:
More buyers are entering the market.
Supports the continuation of the uptrend.
Reflects growing market confidence.
Decreasing Volume in an Uptrend:
Fewer participants are buying at higher prices.
May signal weakening momentum.
Could precede a trend reversal.
Understanding these dynamics is key to effective volume analysis in trading.
Volume price analysis involves studying the relationship between volume and price to make trading decisions. Here's how to read volume in trading:
Identify Volume Spikes:
Look for unusually high volume bars.
Determine if they coincide with significant price moves.
Analyze Volume Patterns:
Observe whether volume is increasing or decreasing over time.
Correlate these patterns with the price trend.
Assess Market Sentiment:
High volume on price increases suggests bullish sentiment.
High volume on price decreases indicates bearish sentiment.
By incorporating volume into your analysis, you can enhance your volume trading strategy and improve the timing of your entries and exits.
To effectively trade using volume, consider the following steps:
Combine Volume with Other Indicators:
Monitor Volume at Key Levels:
Pay attention to volume when the price approaches important levels, such as previous highs or lows.
High volume at these levels can signal potential breakouts or reversals.
Use Volume to Validate Price Moves:
Before entering a trade, check if the price move is supported by volume.
This validation can increase your confidence in the trade.
High volume indicates strong market participation and interest in a security. When combined with price movement, it can signal conviction behind a trend. For example, a price increase with high volume suggests strong buying pressure and likely continued upward movement. Conversely, high volume during a price decline indicates significant selling pressure.
While volume is a powerful indicator, it's most effective when used in conjunction with price action and other technical indicators. Volume confirms the strength of price movements but shouldn't be used in isolation. For optimal results, combine volume analysis with support/resistance levels, trend lines, and momentum indicators like RSI or MACD.
A volume spike is a sudden, significant increase in trading volume compared to recent average levels. Volume spikes often indicate important market events or changing sentiment. When a volume spike occurs at key support or resistance levels, it may signal a potential breakout or reversal. The direction of the price movement during the spike provides context about whether buyers or sellers are in control.
Volume divergence occurs when price and volume trends move in opposite directions, suggesting a potential reversal. For example, if price continues to make higher highs in an uptrend but volume decreases with each new high, this is a bearish volume divergence indicating the trend may be weakening. Conversely, if price makes lower lows but volume decreases on each low, this may signal diminishing selling pressure.
Day traders often use several volume-based indicators to enhance their analysis: (1) On-Balance Volume (OBV) tracks buying and selling pressure over time, (2) Volume-Weighted Average Price (VWAP) shows the average price weighted by volume, useful for identifying fair value, (3) Money Flow Index (MFI) combines price and volume to measure buying/selling pressure, and (4) Chaikin Money Flow measures the accumulation/distribution of money flow over a period. Each provides unique insights when used alongside standard volume analysis.
Understanding and utilizing volume in trading is an essential skill traders should master. By analyzing volume alongside price action, you gain insights into the market's strength and the conviction behind price movements. Whether you're a beginner or an experienced trader, incorporating volume analysis into your strategy can enhance your trading decisions and outcomes.
Ready to take your trading to the next level? Start using volume today in TradingView.
Learn how to effectively use the Relative Strength Index to identify overbought and oversold conditions.
Master the Moving Average Convergence Divergence indicator to spot momentum and trend changes.
Discover how to use the Money Flow Index to analyze both price and volume in your trading strategy.
Learn how to identify and trade using swing points to find optimal entry and exit positions.
(Limited Time: Save 70% Today!)
Unlock cutting-edge trading strategies with InvestingPro.
Access advanced charting tools and premium features.
Join Bybit for high-leverage crypto trading opportunities.
I bought my first stock at 16, and since then, financial markets have fascinated me. Understanding how human behavior shapes market structure and price action is both intellectually and financially rewarding.
I’ve always loved teaching—helping people have their “aha moments” is an amazing feeling. That’s why I created Mind Math Money to share insights on trading, technical analysis, and finance.
Over the years, I’ve built a community of over 200,000 YouTube followers, all striving to become better traders. Check out my YouTube channel for more insights and tutorials.