
Break of Structure (BoS) and Change of Character (CHoCH) Trading Strategy
Master these powerful concepts to identify key market turning points and high-probability trading opportunities.
Are you tired of overcomplicated trading strategies that rarely work in real market conditions? Do you find yourself drowning in indicators that often contradict each other? If so, it's time to master the art of price action trading – the approach used by professional traders across stocks, forex, and cryptocurrency markets.
In this comprehensive guide, we'll break down everything you need to know about price action trading, from foundational concepts to advanced strategies. By the end, you'll have a complete framework for analyzing markets through the lens of price action, giving you a significant edge in your trading journey.
Do you prefer watching over reading? Check out this in-depth price action trading video that covers everything in this article. You'll learn how to identify powerful candlestick patterns, spot key support and resistance levels, trade high-probability breakouts, and use volume to confirm your trades. This comprehensive tutorial takes you step-by-step through real market examples to help you develop the skills professional traders use daily.
Price action is about analyzing how price is currently moving, focusing on the micro details of candlestick patterns
Combining price action with support/resistance levels helps identify strong trading opportunities with higher probability of success
Volume confirms the strength of price action signals - higher volume means more market participants supporting a move
Hammer, shooting star, and engulfing patterns offer reliable reversal signals when properly identified at key levels
Successful breakouts typically feature increased momentum, strong closes above resistance, and higher volume
One of the most misunderstood concepts in trading is price action. Many assume it means trading without indicators, but that's not accurate.
Price action is about analyzing how price is moving in the present moment - studying the current candle or recent candles to understand market behavior.
While market structure is "macro" (zooming out to identify trends, major support/resistance), price action is "micro" - focusing on the details of how price reacts to these levels. For example, a sharp rejection at resistance tells a different story than a slow pullback.
This distinction is crucial because price action helps us understand the quality of price movements, not just the direction.
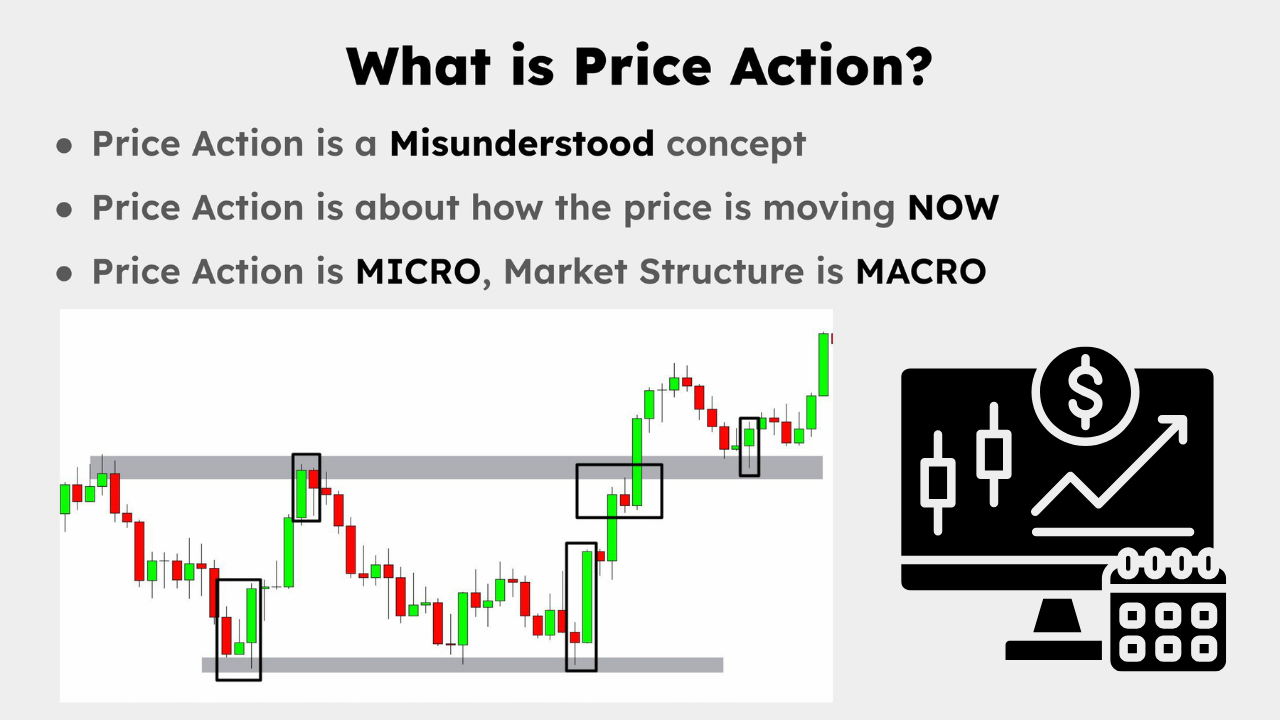
What is Price Action? Price Action is all about how the price is moving right now compared to market structure which is all about how prices have moved in the past. Or in other words, price action trading is micro and market structure trading is macro.
To truly grasp price action trading, you need to understand how it differs from market structure:
Market Structure (Macro):
Zoomed-out view of the market
Identifies major trends (uptrends, downtrends, ranges)
Locates key support/resistance zones
Pinpoints significant swing highs and lows
Recognizes chart patterns spanning many candles
Focuses on the "big picture" market narrative
Price Action (Micro):
Zoomed-in view of specific price movements
Studies individual candlesticks and small groups of candles
Analyzes how price interacts with levels in real-time
Observes momentum shifts through candle formations
Interprets market psychology in the moment
Focuses on the "story" each candle is telling
Many traders make the mistake of focusing exclusively on one while neglecting the other. The master trader integrates both, using market structure to identify where to look, and price action to pinpoint exactly when to enter or exit a trade.
Price action gives traders several distinct advantages:
Universal application - Works across all markets and timeframes
Reduced lag - Shows what's happening now, not what happened in the past
Cleaner chart analysis - Reduces the noise of multiple indicators
Insight into market psychology - Reveals bull/bear conviction levels
Better timing - Helps identify precise entry and exit points
Improved risk management - Clearer placement of stop losses based on price behavior
Most importantly, price action trading helps you develop a deeper intuition about how markets move. After studying thousands of candles across different scenarios, you begin to recognize patterns instinctively, giving you an edge that algorithmic traders often miss.
Candlestick patterns are the building blocks of price action trading. They're either reversal patterns (signaling a change in direction) or continuation patterns (signaling a trend will continue).

Candlestick Patterns are one or multiple candlesticks that indicate either price reversals or price continuations and they are an important part of price action trading.
(Limited Time: Save 70% Today!)
Unlock cutting-edge trading strategies with InvestingPro.
Access advanced charting tools and premium features.
Join Bybit for high-leverage crypto trading opportunities.
Before diving into specific patterns, let's understand the anatomy of a candlestick:
Open: Where the price starts during the time period
Close: Where the price ends when the candle completes
High: The highest point reached during the candle's formation
Low: The lowest point reached during the candle's formation
Real Body: The wide part of the candle (distance between open and close)
Wicks/Shadows: The thin lines extending above and below the real body
The color typically indicates direction - green/white (bullish, closed higher than open) or red/black (bearish, closed lower than open).
![Hammer candlestick pattern illustration]
The hammer is a single-candlestick pattern with specific characteristics:
Small real body (the wide part)
Long lower wick at least 2-3 times the size of the real body
Little or no upper wick
Can be either green or red (color doesn't matter significantly)
What makes a hammer powerful is its context - it should appear after a downtrend and near support levels. The long lower wick shows sellers initially pushed prices down, but buyers regained control before the close, signaling potential reversal.
The hammer tells a compelling story about market psychology:
The price opens and initially moves downward (bears in control)
Selling accelerates, creating a new low (panic selling)
At the low point, buyers step in aggressively (smart money accumulating)
By the close, buyers have pushed price back near the opening level (complete reversal of sentiment)
This shift from extreme bearishness to neutral or even bullish sentiment within a single candle represents a potential exhaustion of selling pressure - a key signal that a downtrend may be ending.
For optimal results when trading hammer patterns:
Confirm the hammer appears after a clear downtrend
Look for hammers that form at or near established support levels
Prioritize hammers with extremely long lower wicks (4x+ the body)
Wait for confirmation on the following candle(s) before entering
Place stops below the low of the hammer's wick
Target the next significant resistance level for profit-taking
The shooting star is essentially an inverted hammer and signals a bearish reversal:
Small real body
Long upper wick (at least 2-3 times the body size)
Little or no lower wick
Appears after an uptrend
Signals potential reversal to the downside
The psychology behind this pattern is that bulls initially pushed the price higher (creating the long upper wick), but by the close, bears had regained control, indicating weakness.
Engulfing patterns consist of two candlesticks and provide strong reversal signals:
Bullish Engulfing Pattern:
First candle: Red, appears after a downtrend
Second candle: Green, opens at or below the close of the first candle
Most importantly, the green candle closes above the open of the red candle
Signals potential reversal to the upside
Bearish Engulfing Pattern:
First candle: Green, appears after an uptrend
Second candle: Red, opens at or above the close of the first candle
The red candle closes below the open of the green candle
Signals potential reversal to the downside
What makes engulfing patterns particularly valuable is their frequency and reliability, especially when they appear at key support or resistance levels.
Doji candles have the open and close at virtually the same level, creating a cross-like appearance. They typically signal uncertainty or indecision in the market:
Classic Doji: Open and close at the same level with upper and lower wicks, showing perfect equilibrium between buyers and sellers
Long-legged Doji: Extended wicks above and below, indicating significant volatility but no directional bias
Dragonfly Doji: Open and close at the high with a long lower wick, showing buyers regained control after selling pressure
Gravestone Doji: Open and close at the low with a long upper wick, showing sellers regained control after buying pressure
Momentum candles have a real body at least twice the size of previous candles, signaling strong directional bias:
They indicate full control by either buyers (bullish) or sellers (bearish)
Often lead to continued momentum in the same direction
When accompanied by high volume, they become even more significant
Appear frequently at the beginning of new trends or after consolidation periods
In my experience, these momentum candles are critical transition points on charts where smart money is taking significant positions.
Support and resistance (S&R) levels are price areas where the market has previously reversed. When combined with price action analysis, they become even more powerful trading tools.

Price Action with Support and Resistance: Support and Resistance are price levels on the chart where the price is more likely to reverse. When you combine price action with support and resistance you can get deeper insights into the strength of these levels.
It's important to understand that all support and resistance levels are potential rather than absolute. Markets rarely respect these levels precisely, and the best traders view S&R as zones rather than exact price points.
The real power comes from observing how price reacts when it reaches these zones. This is where price action analysis becomes invaluable - it tells you whether a level is likely to hold or break.
Not all S&R levels are created equal. Here's how to identify strength:
Look for momentum candles approaching and rejecting from the level
Sharp moves into and away from S&R indicate strength
Example: Multiple strong bullish candles approaching resistance, followed by a strong bearish rejection candle
The velocity of rejection provides clues about the level's importance
Watch for specific candlestick patterns at these levels
A hammer at support or shooting star at resistance strengthens the level
Engulfing patterns at these levels provide even stronger confirmation
Multiple consecutive dojis at a level can indicate a significant decision point
Previous reactions to the level matter
Multiple prior tests that held increase the level's significance
The more dramatic the previous reversals, the stronger the level
Recent tests carry more weight than older ones
Time spent at the level impacts its strength
Levels where price consolidated for extended periods tend to be stronger
Quick touches followed by strong rejections indicate respected levels
Areas where price chopped around without clear direction can become significant
One insight many traders miss: slow, gradual approaches to S&R levels are more likely to break through than sharp, momentum-driven approaches.
Not all support and resistance levels are formed the same way. Here are the main types you should recognize:
Horizontal S&R: The most common type - flat levels where price has reversed multiple times
Trendlines: Diagonal support/resistance formed by connecting swing highs or lows
Moving Averages: Dynamic S&R levels that change with price (particularly the 50, 100, and 200 EMAs)
Fibonacci Retracement Levels: Mathematical S&R based on Fibonacci ratios
Psychological Levels: Round numbers like 10,000, 15,000, etc. that often act as S&R
Previous Gaps: Areas where price jumped, leaving empty space on the chart
Pivot Points: Mathematical calculations used to identify potential turning points
For price action trading, horizontal levels and trendlines typically provide the most reliable signals, as they represent actual buyer and seller activity rather than mathematical projections.
Price action can also tell us when an S&R level is weakening:
Lower highs when approaching support
Each bounce from support becomes weaker (smaller)
Signals declining buying pressure at support
Higher lows when approaching resistance
Each pullback from resistance becomes shallower
Shows increasing buying pressure near resistance
Price "crawling" along the level
Price spending extended time at the level without clear rejection
Shows accumulation/distribution occurring at the level
These patterns often form recognizable chart patterns like ascending and descending triangles, which further confirms the directional bias.
Breakout trading is one of the most exciting and potentially profitable price action strategies. A breakout occurs when price moves beyond a clearly defined support or resistance level.

Price Action Breakout Trading: Breakout trading is one of the most exciting and profitable price action strategies. A breakout occurs when price moves beyond (breaks) a clearly defined support or resistance level.
To trade breakouts effectively, you need to understand the market psychology that drives them:
Trapped traders - When price breaks a significant level, traders positioned against the move are forced to exit (adding fuel to the breakout)
FOMO (Fear Of Missing Out) - New traders rush in, afraid of missing the move
Stop hunting - Large players may push price through a level specifically to trigger stop losses
Momentum shift - The sentiment changes from range-bound to trending
The most powerful breakouts occur when all these factors align, creating a self-reinforcing cycle of buying or selling pressure.
Not all breakouts are created equal. Here are five signs of a genuine breakout:
Increased momentum as the level breaks
Look for a candle significantly larger than previous candles
Shows conviction in the breakout direction
Ideally, the breakout candle should be at least 1.5-2x the average candle size
Strong candle close beyond the level
The further the close is from the broken level, the better
Weak closes just beyond the level often lead to failed breakouts
The close should ideally be in the upper third of the candle for bullish breakouts (lower third for bearish)
Increased volume during the breakout
Higher than average volume confirms more market participants
The highest volume in days/weeks is even more confirming
Look for volume at least 2-3x the average of recent candles
The broken level is significant and obvious
Major levels visible on higher timeframes are best
Historical highs/lows, round numbers, or long-term trendlines work well
The more times a level was tested before breaking, the more significant the breakout
Price action confirmation after the break
Follow-through after the breakout candle
Absence of rejection candles after the break
Ideally, a small consolidation followed by continuation in the breakout direction
A perfect example was Bitcoin's breakout above its previous all-time high around $19,700 in 2020. This level was clearly visible to all traders, the breakout candle showed strong momentum with a close far above resistance, volume was the highest in months, and price continued higher after the break.
For traders looking to refine their breakout strategy, consider these advanced techniques:
Watch for a quick move below support (or above resistance) that rapidly reverses before the actual breakout occurs. This "spring" effect often precedes the strongest breakouts as it clears out weak positions before the main move.
Look for three consecutive attempts to break a level, with each attempt coming closer to breaking through. The third attempt often succeeds and produces a powerful move.
Instead of entering during the initial breakout, wait for price to return to the broken level (which should now act as support/resistance in the opposite direction) and then enter when price confirms the level has flipped.
Breakouts that occur during high-liquidity hours (market open, major session overlaps) are typically more reliable than those that happen during off-hours or low-liquidity periods.
(Limited Time: Save 70% Today!)
Unlock cutting-edge trading strategies with InvestingPro.
Access advanced charting tools and premium features.
Join Bybit for high-leverage crypto trading opportunities.
False breakouts are common and can offer excellent counter-trend trading opportunities if identified correctly:
Decreased or similar momentum during the breakout
Lack of acceleration beyond the level
Suggests weak conviction
Weak close or just a wick beyond the level
Price closing back inside the range
Shows inability to sustain the breakout
No increase in volume
Average or below-average volume on breakout
Indicates lack of broad market participation
The broken level is minor or not clearly visible
Obscure levels that not many traders are watching
Less likely to attract follow-through buying/selling
No clear price action confirmation
Immediate rejection candles after the breakout
Shows opposition to the new direction
A notable example was gold's false breakout above $2,070 where price briefly moved above resistance but failed to close strongly beyond it, followed by a sharp rejection candle with a long upper wick.
Volume is the number of shares, contracts, or cryptocurrency units traded during a given time period. When combined with price action, it provides critical confirmation of pattern strength.

Volume Price Action Trading: A good way to think about volume (or at least how I think about it) is 'how many buyers or sellers are supporting the move.' This means that a price action signal is stronger and more reliable the higher the volume – the more support behind the move.
Volume represents the number of market participants supporting a price move. High volume shows conviction; low volume shows hesitation.
Consider two identical bullish candles:
One forms with 100,000 units traded (high volume)
One forms with only 100 units traded (low volume)
The high-volume candle is substantially more significant because it shows widespread market agreement with the price direction.
This principle applies to all price action signals:
A breakout with high volume is more likely to succeed
A reversal pattern with high volume is more reliable
An uptrend with increasing volume is stronger than one with decreasing volume
In my trading, I've found that volume often precedes price - increasing volume during consolidation frequently signals an impending breakout.
Recognizing these volume patterns will significantly improve your price action trading:
A sudden, abnormally high volume spike often signals exhaustion and potential reversal. This typically occurs after an extended trend and represents capitulation (the last traders throwing in the towel).
How to trade it: Look for reversal candlestick patterns that coincide with the volume climax, then enter in the opposite direction of the previous trend.
When price makes new highs (or lows) but volume fails to confirm with new highs (or lows), it signals weakening momentum and potential reversal.
How to trade it: Be cautious of continuation trades and look for reversal opportunities when price action shows signs of weakness.
Often, volume will increase significantly before a major price move occurs. This represents accumulation or distribution by smart money before the trend becomes obvious.
How to trade it: When you see unusually high volume but price hasn't moved much, prepare for a significant move soon.
During strong trends, pullbacks that occur on lower volume are typically healthy and present good entry opportunities in the direction of the main trend.
How to trade it: Look for low-volume retracements to support/resistance levels, then enter when price action confirms the trend continuation.
To accurately interpret volume bars on your chart:
Compare relative volume, not absolute numbers (is today's volume higher/lower than recent candles?)
Look for patterns and clusters rather than focusing on single volume spikes
Pay attention to volume on key breakout or reversal candles
Notice volume behavior at important technical levels
Understand that higher timeframes provide more reliable volume signals
While basic volume bars are sufficient, these indicators can provide additional insights:
On-Balance Volume (OBV) - Adds or subtracts volume based on whether price closed higher or lower
Volume Profile - Shows volume distribution at different price levels
Volume Moving Averages - Helps identify whether current volume is above/below average
VWAP (Volume-Weighted Average Price) - Important reference point for intraday traders
Remember, these should complement your price action analysis, not replace it. The core principle remains: strong price action signals backed by strong volume are the most reliable trade setups.
While price action can be traded purely with naked charts, several TradingView indicators can enhance your analysis:
This indicator automatically identifies candlestick patterns on your chart:
Marks bullish and bearish engulfing patterns
Identifies hammers, shooting stars, and dojis
Can be filtered by trend direction
Helps confirm patterns you might miss
This indicator:
Automatically detects trend channels
Signals potential breakouts and breakdowns
Combines well with candlestick pattern indicators
Provides objective identification of trends
A valuable tool that:
Automatically identifies trading ranges
Signals when ranges break to either side
Changes color based on breakout direction
Helps spot consolidation before breakouts
This premium Trading View indicator:
Identifies complex chart patterns like head and shoulders, double tops/bottoms
Shows patterns currently forming
Provides price targets based on pattern measurements
Filters patterns based on your trading preferences
These indicators should supplement, not replace, your own price action analysis. They're most effective when combined with support/resistance levels and volume analysis.
To implement a comprehensive price action trading strategy, follow this systematic approach:
Analyze higher timeframes first (structure, S/R zones, bias), then current timeframe (immediate levels, patterns, volume).
Focus on price action at S/R zones, during consolidation, and watch for confirmed breakouts with strong momentum.
Create objective entry rules for reversal trades (patterns at support/resistance) and breakout trades (momentum with volume).
Place stops based on price action, risk 1-2% per trade, and set targets at next major S/R levels with minimum 1:2 risk:reward.
Monitor for continuation signals, be ready to exit if the story changes, and journal all trades for continuous improvement.
Align signals across timeframes, adjust for market context, and develop your personal playbook of high-probability setups.
Higher Timeframe Analysis (Weekly/Daily):
Identify the primary market structure (uptrend, downtrend, or range)
Mark key support and resistance zones on higher timeframes
Note significant swing highs and lows
Identify major trend channels or chart patterns
Determine overall market bias (bullish, bearish, or neutral)
Current Timeframe Analysis (4H/1H):
Find immediate support and resistance levels
Identify current price location relative to key levels
Note any developing chart patterns
Observe recent volume behavior
Look for significant momentum candles
At Support/Resistance Zones:
Watch for specific candlestick patterns (hammers, engulfing patterns)
Look for momentum candles signaling strong moves
Pay attention to how price reacts (sharp rejection vs. gradual approach)
Monitor volume for confirmation
Check for higher highs/higher lows (uptrend) or lower highs/lower lows (downtrend)
During Consolidation Phases:
Identify the trading range boundaries
Watch for contracting volatility (smaller candles)
Look for decreasing volume during consolidation
Prepare for breakout opportunities
Notice false breakouts that quickly reverse
Breakout Confirmation Signals:
Strong momentum candle breaking the level
Closing price well beyond the breakout level
Increasing volume on the breakout candle
Follow-through in subsequent candles
Absence of significant rejection wicks
Create specific, objective conditions for entering trades. For example:
Bullish Reversal Trade:
Price reaches a major support zone on the daily timeframe
A hammer or bullish engulfing pattern forms at support
The pattern has above-average volume
The next candle shows follow-through (closes higher)
Breakout Trade:
Price consolidates near a major resistance level
Higher lows form leading into resistance
A strong momentum candle breaks through resistance
The breakout candle has at least 2x average volume
The candle closes in its upper third
Stop Loss Placement Based on Price Action:
For reversal trades: Beyond the low/high of the signal candle
For breakout trades: Below/above the broken level
Always place stops beyond significant structure points
Account for normal market volatility in the timeframe you're trading
Position Sizing:
Never risk more than 1-2% of your trading capital per trade
Calculate position size based on stop loss distance
Adjust position size based on setup quality (stronger setups can warrant larger positions)
Take Profit Targets:
First target: Next significant support/resistance level
Second target: Major structure points (if using partial take-profits)
Consider risk:reward of at least 1:2 for all trades
Use trailing stops on strong momentum moves
During the Trade:
Monitor price action for continuation or reversal signals
Be prepared to exit if the price action story changes
Consider scaling out at predetermined levels
Move stops to breakeven when price shows sufficient confirmation
Post-Trade Analysis:
Record all trades in a trading journal
Note the price action signals that worked or failed
Identify patterns in your successful and unsuccessful trades
Continuously refine your ability to read price action
As you gain experience, incorporate these advanced concepts:
Multiple Timeframe Confirmation:
Ensure price action signals align across timeframes
Enter on lower timeframes when higher timeframes confirm the direction
Look for confluence between multiple signals
Market Context Awareness:
Adjust expectations based on overall market volatility
Be aware of major economic events that might impact price action
Understand how different market sessions affect price behavior
Pattern Within Pattern Recognition:
Identify micro price action patterns within larger chart patterns
Notice recurring behaviors at specific levels
Develop your own price action "playbook" of high-probability setups
Let's analyze a real trading opportunity using price action principles:
Scenario: Bitcoin Daily Chart (December 2020)
Market Structure Analysis:
Bitcoin had been in a multi-year consolidation below $14,000
Previous all-time high at $19,700 represented major resistance
Price had been making higher lows for several months (bullish structure)
Price Action at Key Level:
As price approached the $19,700 resistance level, it formed a tight consolidation
Several tests of the level showed decreasing selling pressure (smaller red candles)
Higher lows formed as price pushed against resistance (bullish sign)
Breakout Confirmation:
A strong momentum candle broke above the resistance with a decisive close
Volume spiked to the highest level in months
No upper wick on the breakout candle (showing strong buying pressure)
Follow-through candles continued higher without significant pullbacks
Trade Management:
Entry: Above the close of the breakout candle
Stop Loss: Below the low of the consolidation range
Take Profit: Projected based on the height of the consolidation pattern
Result: Substantial profit as Bitcoin continued to new all-time highs
This example demonstrates how combining market structure, price action signals, and volume analysis can identify exceptional trading opportunities.
Price action is micro-focused, analyzing how price is currently moving through candlestick patterns and short-term reactions. Market structure is macro-focused, looking at overall trends, major support/resistance levels, and longer-term price movements. Think of market structure as the "playing field" and price action as the "game being played" in real-time.
No, you don't need indicators to trade price action, but certain indicators can complement your analysis. Price action is primarily about reading the candles and how they interact with key levels. Indicators should enhance, not replace, this analysis. Many successful price action traders use 1-2 indicators at most, focusing on volume indicators or moving averages as supplementary tools.
Price action works on all timeframes, but many traders find the 4-hour and daily charts offer the best balance between signal quality and trading frequency. Lower timeframes generate more signals but with lower reliability, while higher timeframes produce fewer but more reliable signals. Beginners should start with daily charts to learn the patterns before moving to lower timeframes where noise can make interpretation more challenging.
Volume is extremely important as it confirms the strength of price action signals. High volume on a pattern or breakout indicates more market participants agree with the direction, making the signal more reliable. Low volume suggests weak conviction. Think of volume as the "validator" of price movements - strong price action signals with weak volume are like claims without evidence.
Engulfing patterns (both bullish and bearish) tend to be among the most reliable, especially when they occur at key support/resistance levels with above-average volume. Hammer patterns at support and shooting stars at resistance also provide strong signals when properly confirmed. However, no pattern works 100% of the time - their reliability increases when they appear at significant levels and are accompanied by supporting volume.
To minimize false breakout trades: 1) Wait for a strong close beyond the level (not just a wick), 2) Confirm increased volume on the breakout candle, 3) Look for momentum (larger than average candles), 4) Wait for a second confirmatory candle after the breakout, 5) Be more cautious with breakouts that occur on low volume or during off-hours, 6) Consider entering after a successful retest of the broken level.
Price action trading is both an art and a science. It requires understanding what price is telling you in the moment, while maintaining awareness of the broader market context.
The most successful price action traders combine candlestick analysis with support/resistance, volume, and selective use of indicators. They recognize that price action is not about eliminating all tools, but rather about focusing on how price is actually moving and reacting to key levels.
By mastering the candlestick patterns and concepts outlined in this guide, you'll develop the ability to "read" the market more effectively and make more informed trading decisions. Remember that practice is essential - spend time analyzing historical charts to identify these patterns and observe how they played out.
The beauty of price action trading lies in its simplicity and effectiveness. While indicators may come and go in popularity, the core principles of price action have remained relevant for decades and will continue to work because they're based on fundamental market psychology that doesn't change.
Remember: This educational content is not financial advice. Always practice proper risk management and consider your own financial situation before trading.
Master these powerful concepts to identify key market turning points and high-probability trading opportunities.
Learn how to classify price levels to find the highest probability trading opportunities with precise entries and exits.
Discover how institutional traders hunt for liquidity and how you can profit from these powerful market movements.
Master the art of identifying key market turning points using swing analysis for consistently profitable trades.
(Limited Time: Save 70% Today!)
Unlock cutting-edge trading strategies with InvestingPro.
Access advanced charting tools and premium features.
Join Bybit for high-leverage crypto trading opportunities.
I bought my first stock at 16, and since then, financial markets have fascinated me. Understanding how human behavior shapes market structure and price action is both intellectually and financially rewarding.
I’ve always loved teaching—helping people have their “aha moments” is an amazing feeling. That’s why I created Mind Math Money to share insights on trading, technical analysis, and finance.
Over the years, I’ve built a community of over 200,000 YouTube followers, all striving to become better traders. Check out my YouTube channel for more insights and tutorials.