
Understanding the MACD Indicator: MACD Line, Signal Line, Histogram, Crossover, and Zero Line
Dive deeper into the mechanics and applications of each MACD component for more sophisticated trading strategies.
Last Updated: April 15, 2025
The MACD indicator consists of three components: the MACD line (difference between 12 and 26-period EMAs), the signal line (9-period EMA of MACD line), and the histogram (visual representation of the difference between MACD and signal lines).
Adding the MACD indicator to TradingView is simple: click the "Indicators" button, search for "MACD," and select the standard "Moving Average Convergence Divergence" option, which will appear at the bottom of your chart.
The MACD crossover strategy provides clear signals: buy when the MACD line crosses above the signal line (indicating increasing bullish momentum) and sell when it crosses below (indicating bearish momentum).
MACD divergence provides powerful early warning signals of potential trend reversals - bullish divergence occurs when price makes lower lows while MACD makes higher lows, while bearish divergence happens when price makes higher highs but MACD makes lower highs.
For best results, avoid relying solely on the MACD indicator - combine it with other technical analysis tools, understand market context (MACD works best in trending markets), and test different timeframes to find what aligns with your trading strategy.
If you're new to trading or technical analysis, the MACD (Moving Average Convergence Divergence) indicator is one of the most powerful tools you can add to your arsenal. This guide will walk you through how to use the MACD indicator on TradingView, with step-by-step instructions and insights into how it works. Let's dive in!
Learn how to add and customize the MACD indicator in TradingView with this quick tutorial! Perfect for beginners, this guide explains the basics of the MACD, how it measures momentum, and how to use it effectively in your trading strategies.
The MACD is a momentum-based indicator that helps traders identify trends, reversals, and potential entry or exit points in the market. It consists of three key components:
MACD Line: Shows the difference between two moving averages (commonly the 12-period and 26-period EMA).
Signal Line: A 9-period EMA of the MACD line that acts as a trigger for buy and sell signals.
Histogram: Represents the difference between the MACD line and the signal line, visually indicating momentum strength.

How the MACD Indicator Works: Histograms, MACD Line, and Signal Line Explained.
To add the MACD indicator in TradingView:
Go to the Chart Interface: Open your TradingView account and navigate to the chart you want to analyze.
Click on the "Indicators" Button: Look for the "Indicators" button located at the top of the screen.
In the search bar, type "MACD."
You’ll see a list of options. The default "Moving Average Convergence Divergence" by TradingView is a great starting point for beginners.
Click on the standard "Moving Average Convergence Divergence" option to add it to your chart. The MACD indicator will appear at the bottom of your screen.
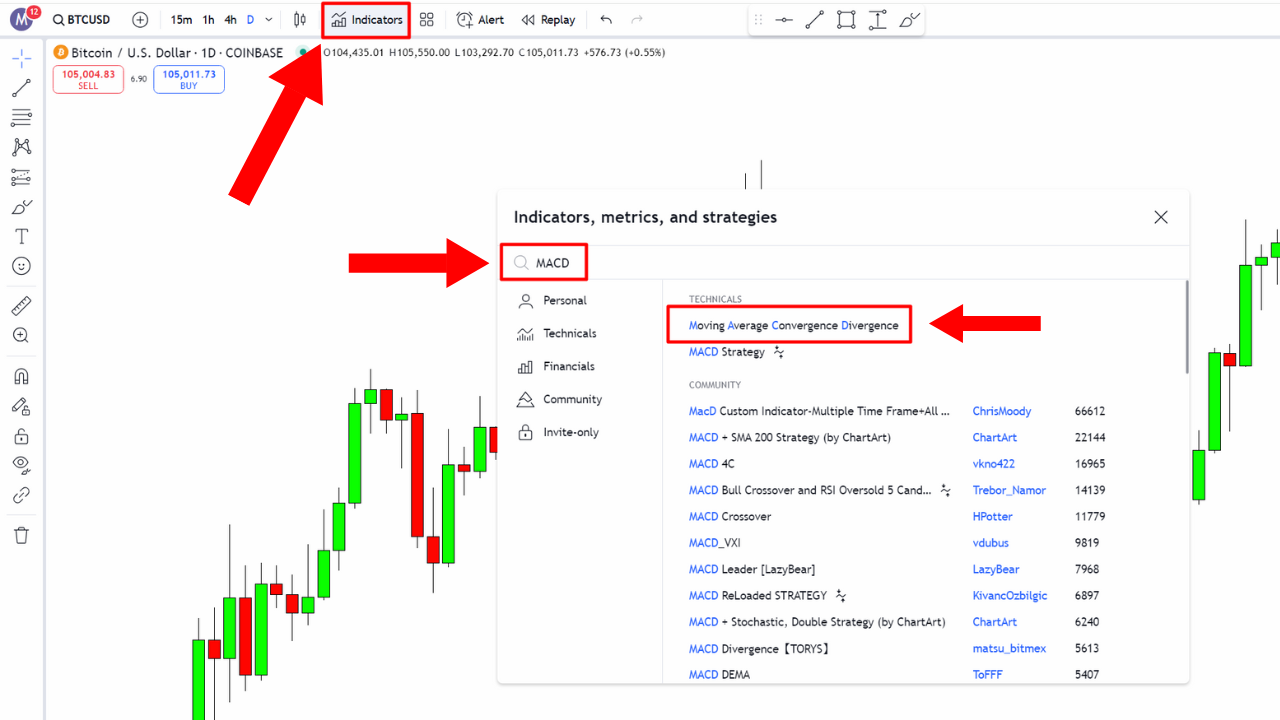
Learn how to quickly add the MACD indicator on TradingView: Open the Indicators tab, search for 'MACD,' and select 'Moving Average Convergence Divergence' under the Technicals tab.
TradingView allows you to customize the MACD settings:
Click on the Indicator Settings (Gear Icon): Hover over the MACD indicator and click the gear icon.
Adjust the Parameters: You can change the default EMA values (12, 26, 9) to suit your trading style. However, the default settings work well for most traders.
Change Colors and Appearance: You can customize the colors of the MACD line, signal line, and histogram for better visibility.
The MACD indicator is versatile and can be used in multiple ways. Here are some key concepts:
Strong Upward Momentum: When the MACD line crosses above the signal line, it suggests increasing bullish momentum.
Strong Downward Momentum: When the MACD line crosses below the signal line, it indicates bearish momentum.
The histogram expands during strong trends and contracts during consolidation periods.
Look for changes in the histogram’s size as an early signal of potential trend reversals.
Bullish Divergence: When the price makes lower lows, but the MACD makes higher lows, it signals potential upward reversal.
Bearish Divergence: When the price makes higher highs, but the MACD makes lower highs, it signals potential downward reversal.

MACD Bullish Divergence occurs when the price forms lower lows while the MACD histogram forms higher lows, signaling potential upward momentum and a possible trend reversal.
Here are some simple and effective strategies you can use:
Buy Signal: When the MACD line crosses above the signal line.
Sell Signal: When the MACD line crosses below the signal line.
Look for divergence between price action and the MACD as an early indicator of potential reversals.
Observe the histogram for shrinking bars, which often signal momentum loss and potential trend changes.
Relying Solely on the MACD: Always use the MACD in combination with other indicators or support and resistance levels.
Ignoring Market Context: MACD works best in trending markets and may produce false signals in sideways or choppy markets.
Overlooking Timeframes: Test the MACD on multiple timeframes to find the one that aligns with your trading strategy.
On TradingView, you’ll find hundreds of community-created MACD indicators under the "Community Scripts" section. These can offer unique variations, such as:
Colored histograms for better visualization.
Alerts for specific crossover or divergence signals.
To explore community scripts:
Search "MACD" under the "Indicators" menu.
Look for scripts labeled "Community."
Take your trading skills to the next level with our comprehensive MACD indicator course. Whether you're a beginner learning the basics or an advanced trader refining your strategies, this ultimate guide will equip you with everything you need to master the MACD and elevate your trading game.
The MACD (Moving Average Convergence Divergence) indicator measures momentum and trend direction by calculating the relationship between two moving averages. It shows the difference between a 12-period and 26-period Exponential Moving Average (EMA), and includes a signal line which is a 9-period EMA of the MACD line. The indicator helps traders identify potential trend changes, measure momentum strength, and generate buy or sell signals through various patterns and crosses.
The MACD is primarily a lagging indicator because it's based on moving averages, which by nature react to price changes after they occur. However, the MACD can provide some leading qualities through divergence patterns. When price makes new highs/lows but the MACD doesn't confirm with corresponding highs/lows (divergence), it can signal potential reversals before they happen. So while its crossover signals tend to lag price moves, MACD divergence can function as a leading indicator in certain market conditions.
To identify MACD divergence on TradingView, look for situations where price movement doesn't align with MACD movement. For bullish divergence: look for when price makes lower lows while the MACD histogram or line makes higher lows. For bearish divergence: look for when price makes higher highs while the MACD makes lower highs. You can use TradingView's drawing tools to draw trendlines connecting the price lows/highs and corresponding MACD lows/highs to visually confirm the divergence. Some traders also use community-created MACD scripts that automatically highlight divergences.
The MACD indicator can work on any timeframe, but its effectiveness varies depending on your trading style. For day traders, shorter timeframes like 5-minute, 15-minute, and hourly charts might be suitable. Swing traders often find value on 4-hour and daily charts. Long-term investors might prefer daily, weekly, or monthly timeframes. Many experienced traders recommend using multiple timeframes - for example, identifying the trend on a larger timeframe (like daily) and then finding entry points on a smaller timeframe (like hourly). The key is to test different timeframes to find what aligns with your specific trading strategy and time horizon.
Yes, you can customize MACD settings in TradingView by clicking the gear icon when you hover over the indicator. While the standard settings (12, 26, 9) work well for many traders, adjusting these parameters can optimize the indicator for specific assets or trading styles. For faster signals in volatile markets, you might use shorter periods (e.g., 8, 17, 9). For less noise and fewer false signals in trending markets, longer periods (e.g., 19, 39, 9) might be appropriate. Popular custom settings include Linda Raschke's 3, 10, 16 configuration for shorter-term trading. Always backtest any customized settings thoroughly to validate their effectiveness for your specific trading approach and market conditions.
The MACD is a must-have tool for any trader looking to improve their technical analysis. By learning how to use it effectively in TradingView, you can spot trends, anticipate reversals, and make more informed trading decisions. Remember to practice on a demo account and combine the MACD with other tools for the best results.
For even more trading insights, check out my free 2-hour TradingView course here: 👉 Full TradingView Course
Dive deeper into the mechanics and applications of each MACD component for more sophisticated trading strategies.
Discover how legendary trader Linda Raschke customizes the MACD for her successful trading approach.
Learn advanced MACD strategies that are working in today's markets with updated techniques for 2025.
Find out which TradingView plan offers the best value for technical analysis and MACD indicator usage.
I bought my first stock at 16, and since then, financial markets have fascinated me. Understanding how human behavior shapes market structure and price action is both intellectually and financially rewarding.
I’ve always loved teaching—helping people have their “aha moments” is an amazing feeling. That’s why I created Mind Math Money to share insights on trading, technical analysis, and finance.
Over the years, I’ve built a community of over 200,000 YouTube followers, all striving to become better traders. Check out my YouTube channel for more insights and tutorials.