
How to Use the RSI Indicator in TradingView
Compare RSI with MACD for momentum trading in TradingView.
Updated March 4, 2025
The MACD tracks momentum using 12 and 26-period EMAs, with a 9-period signal line.
Crossovers (MACD vs. signal line) signal bullish or bearish momentum shifts.
Divergences between MACD and price hint at potential trend reversals.
Combine MACD with other tools to avoid false signals and boost accuracy.
The MACD (Moving Average Convergence Divergence) is a momentum indicator designed to reveal the relationship between two Exponential Moving Averages (EMAs) of a security's price. This might sound complex at first, but let's break it down step by step.
How It Works:
Calculation: The MACD line is calculated by subtracting the 26-period EMA from the 12-period EMA. The result of this calculation is the MACD line itself.
Signal Line: To add further depth, a nine-day EMA of the MACD line is calculated, and this is known as the signal line. The signal line is then plotted on top of the MACD line.
Signal Generation: Traders may use the MACD by buying (going long) the security when the MACD line crosses above the signal line or selling (going short) when the MACD line crosses below the signal line. However, this is a simplistic way to use the MACD indicator and might provide limited value.
Interpreting MACD: The MACD indicator can be interpreted in several ways, but the more common methods include crossovers, divergences, and rapid rises/falls.
Now, let's take a closer look at the MACD formula itself:
MACD = 12-Period EMA - 26-Period EMA
Subtracts the long-term (26-period) EMA from the short-term (12-period) EMA to measure momentum.
Signal Line = 9-Period EMA of MACD Line
A 9-period EMA of the MACD line, used to generate buy/sell signals.
Histogram = MACD Line - Signal Line
Shows the difference between MACD and Signal Line, indicating momentum strength.
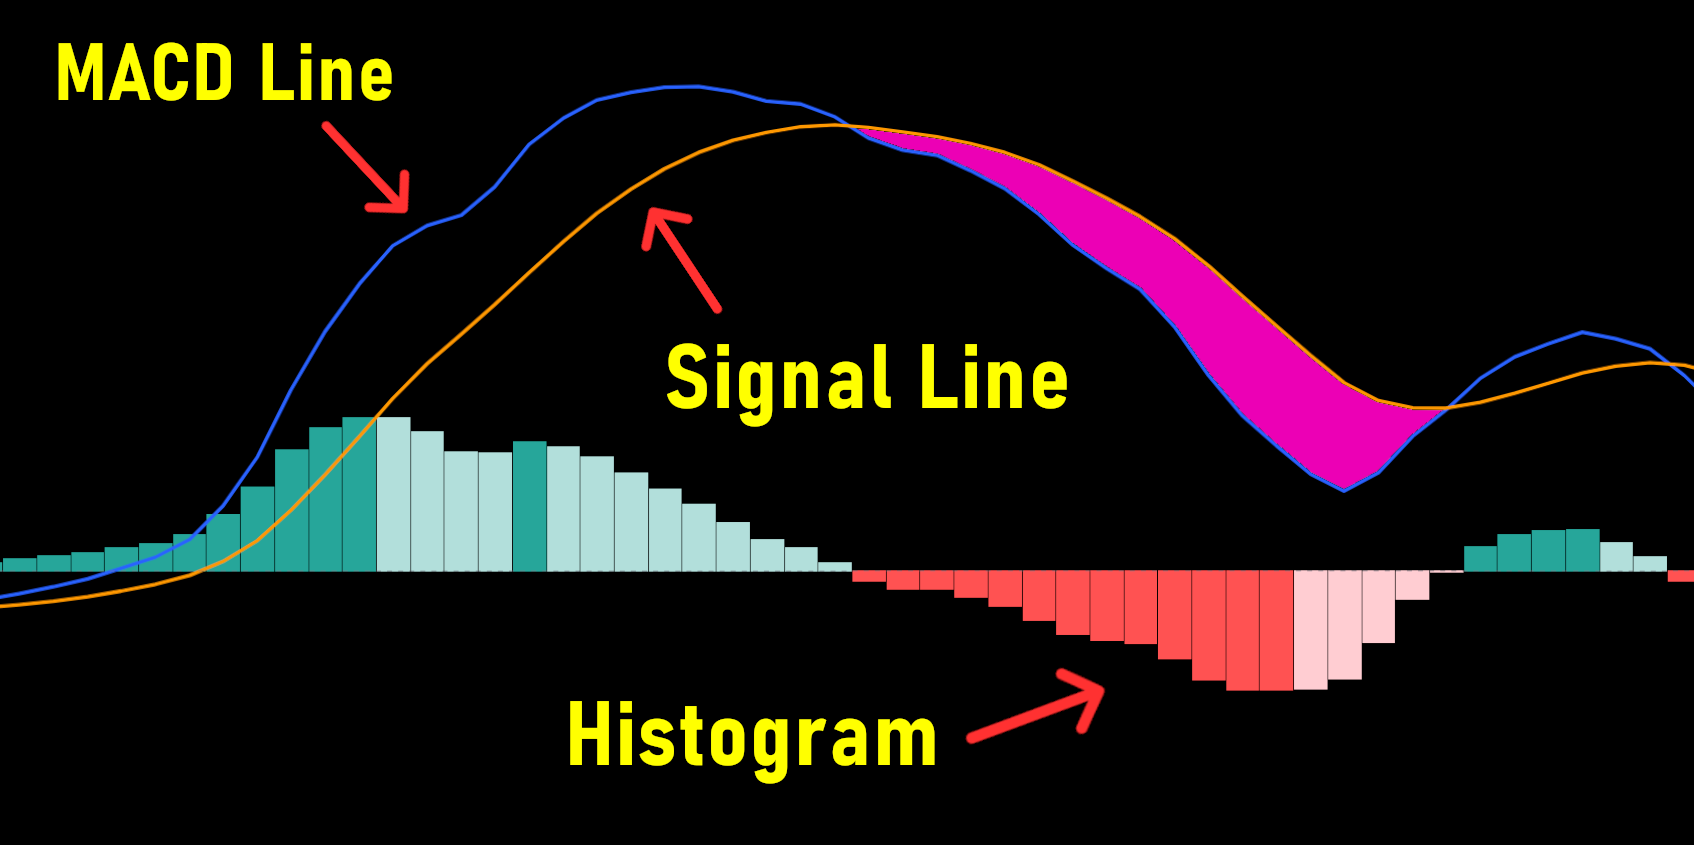
MACD Line, Signal Line, and MACD Histogram
Here's what this means:
The 12-period EMA represents the short-term moving average.
The 26-period EMA signifies the long-term moving average.
The Signal Line is a moving average of the MACD line itself
The Histogram is the distance between the MACD and Signal Line
EMAs, or Exponential Moving Averages, assign more significance to recent data points. This means they are more responsive to current market conditions than simple moving averages (SMAs).
The MACD's value fluctuates, offering insights into market sentiment. It comprises two key elements: the MACD line and the signal line.
MACD Line Above Signal Line: When the MACD line is above the signal line, it suggests bullish momentum. This is may be viewed as a potential buying opportunity.
MACD Line Below Signal Line: Conversely, when the MACD line falls below the signal line, it signifies bearish momentum. Traders can consider this as a signal to be cautious or potentially consider selling.
Histogram Insights: The histogram, derived from the MACD and signal line, provides a visual representation of the MACD's movement. When it's above the baseline, it indicates bullish momentum, while below the baseline suggests bearish momentum.
Now, let's compare the MACD with another popular indicator, the Relative Strength Index (RSI):
Range: The RSI oscillates between 0 and 100, providing a clear range of values.
Interpretation: RSI is used to determine overbought and oversold conditions. A reading above 70 suggests overbought, while a reading below 30 suggests oversold.
In contrast, the MACD does not have concrete overbought/oversold levels like the RSI. Instead, it focuses on the relative positioning and movement of the MACD and signal lines. Traders should analyze the MACD and signal lines in comparison to preceding price movements to gauge potential trend changes.
While the RSI and MACD both measure momentum in a market, they consider different factors and sometimes offer contradictory indications. For example, the RSI may show a reading above 70 (indicating overbought) for an extended period, suggesting that the market is overextended on the buy side. However, the MACD may indicate that buying momentum is decreasing. In such cases, the MACD may suggest an upcoming trend change by showing divergence from price movements.
Divergence between the MACD and other indicators can provide valuable insights into potential trend changes. For instance:
Bullish Divergence: This occurs when the MACD forms two higher lows that correspond with two falling lows on the price chart. This indicates a potential reversal to the upside.
Bearish Divergence: This forms when the MACD prints two falling highs that correspond with two rising highs on the price chart. A bearish divergence indicates a potential reversal to the downside.
However, it's important to note that while divergences can be powerful signals, they should not be used in isolation. It's often recommended to combine them with other technical analyses for a more comprehensive view of the market.

Bearish MACD Divergence
While the MACD is a valuable tool, it does have its limitations. One significant challenge is the potential for false signals. In other words, the MACD may indicate a possible trend reversal, but this reversal might not materialize, leading to missed opportunities or unnecessary trades.
To mitigate this risk and improve the likelihood of successful trading, traders often seek to combine the MACD indicator with other technical tools, such as additional moving averages or traditional technical analysis tools and concepts like support and resistance, price action, and market structure.
The MACD (Moving Average Convergence Divergence) is a momentum indicator that shows the relationship between two Exponential Moving Averages (12-period and 26-period) of a security’s price.
The MACD line is calculated by subtracting the 26-period EMA from the 12-period EMA. The signal line is a 9-period EMA of the MACD line, and the histogram shows the difference between them.
A crossover occurs when the MACD line crosses the signal line. Above suggests bullish momentum (buy), below indicates bearish momentum (sell), but confirmation is advised.
MACD divergence happens when the MACD moves opposite to price (e.g., higher MACD lows vs. lower price lows), signaling potential trend reversals—bullish or bearish.
No, MACD is best paired with other tools like RSI, moving averages, or price action to avoid false signals and improve accuracy.
The MACD indicator is a valuable tool for traders and investors, especially when combined with other technical tools. Its ability to react to price changes, coupled with its signal-generating potential is a big reason why the MACD is still popular and widely used today. However, cautious use and confirmation from complementary indicators are essential to maximize its effectiveness. By mastering the MACD, you can gain a deeper understanding of market trends and improve your trading decisions.
Compare RSI with MACD for momentum trading in TradingView.
Enhance MACD with moving averages for trend confirmation.
Dive deeper into MACD’s lines, signals, and histogram.
Apply MACD with expert settings for stocks, forex, and crypto.
(Limited Time: Save 70% Today!)
Unlock cutting-edge trading strategies with InvestingPro.
Access advanced charting tools and premium features.
Join Bybit for high-leverage crypto trading opportunities.
I bought my first stock at 16, and since then, financial markets have fascinated me. Understanding how human behavior shapes market structure and price action is both intellectually and financially rewarding.
I’ve always loved teaching—helping people have their “aha moments” is an amazing feeling. That’s why I created Mind Math Money to share insights on trading, technical analysis, and finance.
Over the years, I’ve built a community of over 200,000 YouTube followers, all striving to become better traders. Check out my YouTube channel for more insights and tutorials.