
How To Add Moving Averages in TradingView
A step-by-step guide to adding and customizing moving averages on TradingView's platform.
Last Updated: March 7, 2025
The Simple Moving Average (SMA) smooths price data by calculating the average price over a specified period, making trends more visible
There is no "perfect" SMA length—the most effective one depends on your specific trading strategy and timeframe
Price consistently above a long-term SMA suggests an uptrend, while price below indicates a downtrend—helping traders identify favorable market conditions
SMAs work best as part of a comprehensive trading strategy, not as standalone decision-making tools
Experiment with different SMA periods to find what works best for your specific trading style and market conditions
In the world of financial markets, the Simple Moving Average (SMA) stands as an indicator for traders seeking to improve their navigation of price movements. Yet, amidst a sea of recommendations and purported "best" practices, a critical question arises: What makes a specific moving average the go-to choice over another? The pursuit of this question uncovers a fundamental truth about moving averages — there is no one-size-fits-all answer, no magic number that outshines the rest. This guide aims to debunk the myths surrounding SMAs and provide a clear-eyed view of how they truly operate, equipping traders with the knowledge to employ moving averages effectively, free from common misconceptions.

20-Period Simple Moving Average (SMA) plotted on the Bitcoin daily chart
(Limited Time: Save 70% Today!)
Unlock cutting-edge trading strategies with InvestingPro.
Access advanced charting tools and premium features.
Join Bybit for high-leverage crypto trading opportunities.
At its core, the SMA is a tool designed to smooth out price data by calculating the average price of a security over a specified period. This process involves summing up the closing prices over the chosen timeframe and dividing the total by the number of periods. For instance, a 9-period SMA on a daily chart would reflect the average closing price of the past 9 days. By updating with each new closing price, the SMA provides a dynamic yet straightforward reflection of price trends.
The frequent assertion that certain SMAs, like the 50-day or 200-day, possess inherent superiority is a myth worth dispelling. The reality is that the effectiveness of an SMA depends largely on its alignment with your trading strategy and objectives. A 69-day SMA can be just as valid as a 200-day SMA, depending on the context of its application. The choice of SMA length should be informed by a clear understanding of what you aim to achieve, be it trend identification, support and resistance levels, or signaling for buy or sell opportunities.
Calculating an SMA is straightforward but insightful. Consider a 5-day SMA: by taking the closing prices of the last 5 days, adding them together, and dividing by 5, you obtain an average that reflects the market's recent behavior.
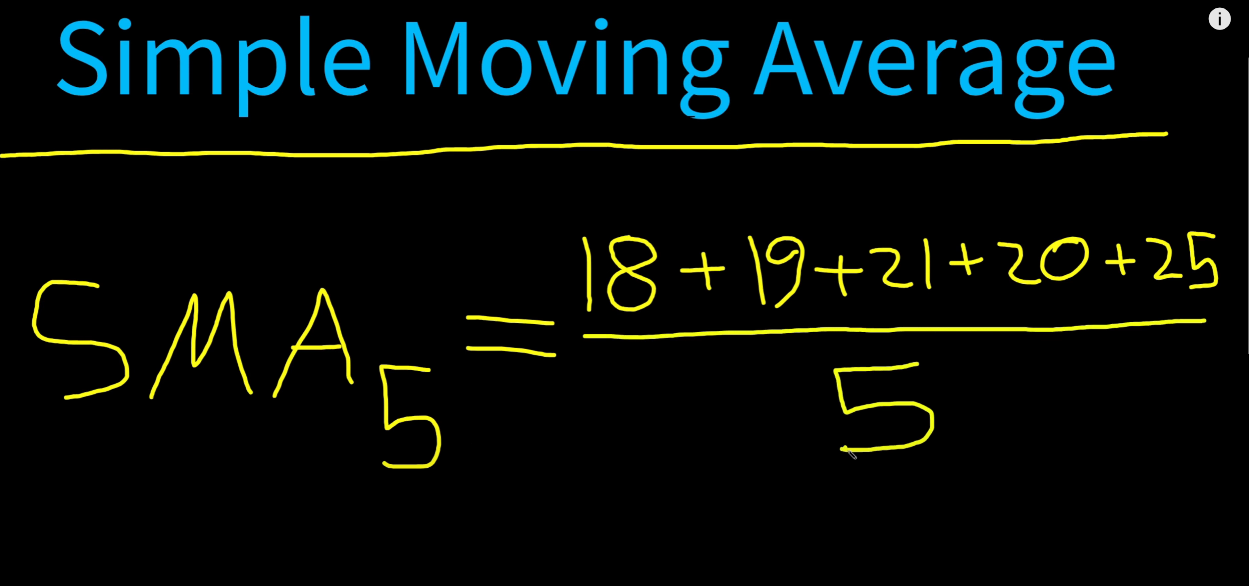
5 Day Simple Moving Average Calculation (Moving Average Formula)
While some traders might attempt to use SMAs as rigid support or resistance markers, this approach often falls short of expectations. The SMA's true value lies in its ability to signal trend directions and potential shifts. For instance, when the price consistently remains above a long-term SMA, it suggests an underlying uptrend. Conversely, price movement below the SMA may indicate a downtrend. This characteristic makes SMAs invaluable for identifying favorable trading conditions and avoiding periods of market equilibrium where price movements become unpredictable.
A common pitfall among traders is an overreliance on SMAs for making trading decisions. This stems from a misconception of the SMA as a predictor rather than an indicator. To navigate this, traders should view SMAs as one component of a broader analytical framework, combining them with other indicators and analysis techniques to form a more holistic trading strategy. By understanding the SMA's limitations and strengths, traders can leverage it as a powerful tool for trend analysis and market timing.
There is no single "best" SMA period that works for all trading situations. The most effective SMA depends on your trading timeframe, strategy, and the specific market you're trading. Short-term traders might prefer 9, 20, or 50-period SMAs, while long-term investors often use 100 or 200-period SMAs. It's recommended to experiment with different periods to discover what aligns best with your trading style and objectives.
The main difference is in how they weigh price data. The Simple Moving Average (SMA) gives equal weight to all prices in the calculation period. In contrast, the Exponential Moving Average (EMA) places more emphasis on recent prices, making it more responsive to new information. This means the EMA reacts faster to price changes, while the SMA provides a smoother, less reactive view of the market trends.
While it's possible to use SMAs alone, it's generally not recommended to base trading decisions solely on a single indicator. SMAs are most effective when used as part of a comprehensive trading strategy that includes other technical analysis tools, fundamental analysis, and proper risk management. Combining SMAs with other indicators like RSI, MACD, or volume analysis can provide more reliable trading signals.
To identify trends using SMAs: 1) An uptrend is typically indicated when the price is trading above the SMA and the SMA is sloping upward. 2) A downtrend is suggested when the price is trading below the SMA and the SMA is sloping downward. 3) Multiple SMAs of different periods can be used together - when shorter-period SMAs cross above longer-period ones, it may signal an uptrend beginning, and vice versa for downtrends.
SMAs lag because they're based on historical data. By definition, a moving average calculates the average price over a previous period, which means it's always incorporating past prices. The longer the SMA period, the more lag it will have. This lag is both a weakness (delayed signals) and a strength (filtering out market noise). Traders need to understand this inherent lag when using SMAs and adjust their strategies accordingly.
The journey through the world of SMAs reveals a landscape where flexibility and understanding reign supreme. By moving beyond the search for the "perfect" moving average and embracing the nuanced role of SMAs in market analysis, traders can unlock their full potential. The key lies in asking the right questions, experimenting with different periods, and integrating SMAs into a comprehensive trading strategy. Armed with this knowledge, traders are well-positioned to navigate the complexities of the market with confidence and insight.
If you prefer to digest information visually, here’s a video diving deep into moving averages in trading.
Moving Averages Explained for Visual Learners
A step-by-step guide to adding and customizing moving averages on TradingView's platform.
Discover how the ALMA differs from traditional moving averages and its unique advantages in trading.
Learn how to combine market structure analysis with moving averages for powerful trading signals.
Discover how price action trading complements moving average analysis for more precise trading decisions.
(Limited Time: Save 70% Today!)
Unlock cutting-edge trading strategies with InvestingPro.
Access advanced charting tools and premium features.
Join Bybit for high-leverage crypto trading opportunities.
I bought my first stock at 16, and since then, financial markets have fascinated me. Understanding how human behavior shapes market structure and price action is both intellectually and financially rewarding.
I’ve always loved teaching—helping people have their “aha moments” is an amazing feeling. That’s why I created Mind Math Money to share insights on trading, technical analysis, and finance.
Over the years, I’ve built a community of over 200,000 YouTube followers, all striving to become better traders. Check out my YouTube channel for more insights and tutorials.