

Best TradingView Indicators for 2025: Custom Settings Included
Discover how to transform standard TradingView indicators into powerful trading tools with these professional-level custom settings. Learn the my exact MACD, Pivot Point, and Volume Footprint configurations, also used by expert traders to spot reversals faster and identify high-probability trading zones.

The Ultimate TradingView Tutorial for 2025 and Beyond
Are you looking to take your trading to the next level with TradingView? Whether you're a beginner or an experienced trader, this comprehensive TradingView guide for 2025 covers everything you need you need to know, from setting up your account to mastering advanced technical analysis tools, indicators, and risk management. Learn how to customize charts, set up alerts, and use TradingView effectively!

The Breakout TradingView Indicator: Your Ultimate Guide to Price Action Trading
Discover how the Breakout TradingView Indicator can simplify your trading process by detecting key ranges and breakout points automatically. This guide offers practical insights for combining the indicator with price action strategies, optimizing settings, and improving your forex, crypto, or stock trading approach. Perfect for traders of all levels looking to improve!

Understanding the Money Flow Index (MFI): An In-Depth Guide to the MFI Indicator
Discover how the Money Flow Index (MFI) combines price and volume to provide unique market insights. This comprehensive guide covers everything from adding the MFI indicator on TradingView to using it effectively for spotting divergences and enhancing your trading strategy.

The Pivot Point Trading Strategy: How to use the TradingView Pivot Point Indicator
Pivot points are a powerful tool in technical analysis, helping traders identify key support and resistance levels in the market. This guide explores how to use the Pivot Points High Low indicator on TradingView, offering step-by-step instructions, practical examples, and tips for configuring the indicator to maximize its effectiveness.
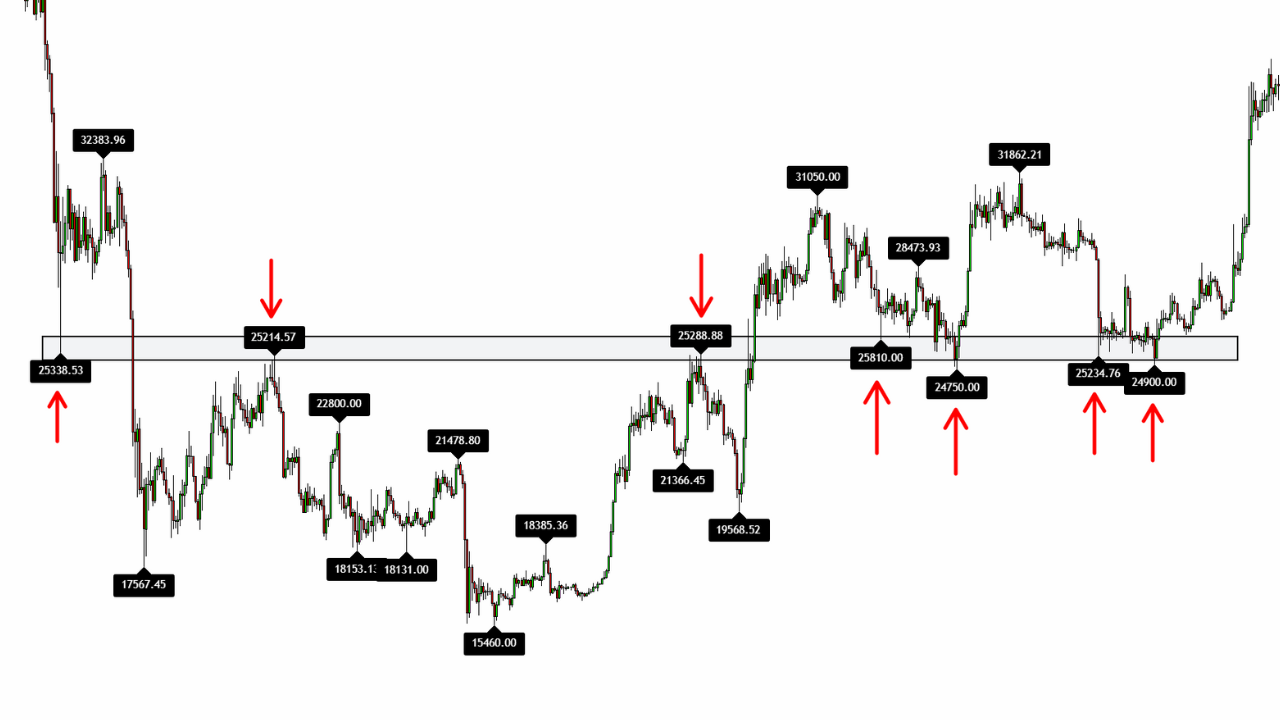
Support and Resistance TradingView Indicator: The Pivot Point Trading Strategy
The Pivot Points High and Low Indicator is one of the most effective tools on TradingView for identifying key support and resistance levels. In this article, you'll learn how to set it up and use it step-by-step to potentially improve your trading strategy.
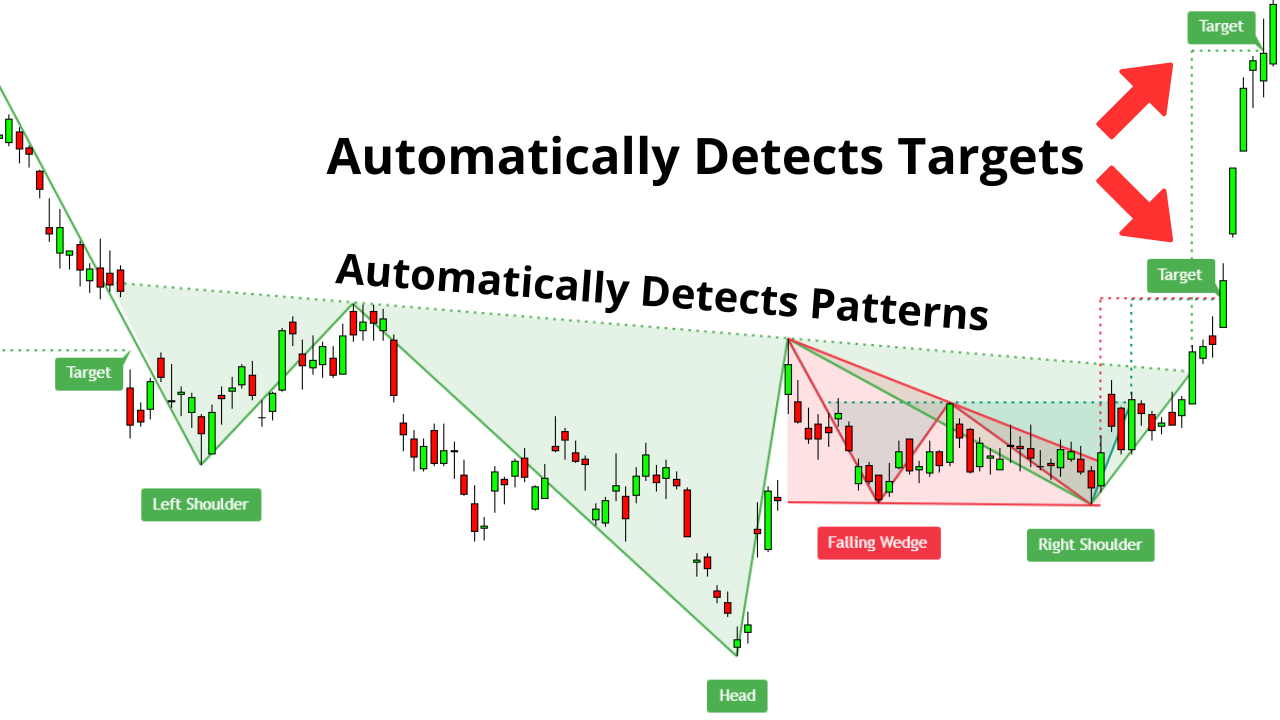
The Auto Chart Patterns TradingView Indicator: A Comprehensive Guide
The Auto Chart Patterns TradingView Indicator is one of the most powerful tools for automated chart pattern recognition. In this comprehensive guide, you'll learn how to use this premium indicator to identify profitable trading setups like head and shoulders, double tops, and wedges without manual analysis.

Understanding the Simple Moving Average (SMA) Trading: A Quick Guide
The Simple Moving Average (SMA) is fundamental for identifying trends and market conditions, but there's no magic SMA period that works for all situations. This guide debunks common SMA myths, shows you how to calculate and interpret SMAs correctly, and explains how to incorporate them into a comprehensive trading strategy for stocks, forex, and crypto markets.

How to Use the RSI Indicator in TradingView (2025)
Master the Relative Strength Index (RSI) in TradingView with this concise guide. Learn to set up and interpret this powerful momentum indicator to boost your trading decisions. Uncover the meaning of overbought (above 70) and oversold (below 30) levels, and sharpen your skills in spotting RSI divergences to predict market reversals. Perfect for beginners and seasoned traders alike, this updated 2025 guide also explores pairing RSI with moving averages for smarter, more confident technical analysis. Start elevating your trades today!