
Volume Analysis in Trading: A Guide to Volume Indicators and Strategies
Master the essential volume indicators and discover how to use volume analysis to confirm price movements and predict market shifts.
Disclaimer: The following content is for educational purposes only and should not be considered financial advice. Trading involves risk, and past performance is not indicative of future results. Always conduct your own research before making investment decisions.
Like video format? Watch the original Footprint Chart Tutorial on YouTube where I explain all about volume footprint charts, including how to set them up in TradingView and the exact settings I use for profitable trading. This walkthrough shows you step-by-step how to interpret buying and selling pressure at specific price levels - something that's much easier to understand when you can see it in action.
Volume footprint charts reveal buying and selling pressure at specific price levels, offering deeper market insights than traditional candlestick charts
The Delta measurement (difference between buying and selling volume) is crucial for identifying underlying market strength
Point of Control (POC) shows where most volume traded, helping identify key support/resistance levels
The most effective volume footprint strategy looks for alignment between price movement and volume direction
Best results come from combining volume footprint analysis with market structure recognition (support/resistance levels)
Have you ever felt like traditional candlestick charts don't tell the whole story? Like you're missing critical information about what's actually driving price movement? You're not alone.
While standard charts show price action, they don't reveal the underlying battle between buyers and sellers at specific price levels. This is precisely why volume footprint charts have become the secret weapon for advanced traders looking to gain an edge in volatile markets.
In this comprehensive guide, I'll walk you through exactly how to read, understand, and trade with volume footprint charts - showing you why they're considered one of the most powerful chart types available to modern traders.
Volume footprint charts are advanced data visualization tools that display buying and selling pressure at each price level within a candle. Unlike traditional candlestick charts that only show open, high, low, and close values, footprint charts reveal the volume traded at each price increment, giving you a much clearer picture of market dynamics.
Think of it as x-ray vision for your charts - you're no longer just seeing the skeletal structure of price movement, but the actual muscle (volume) behind it.
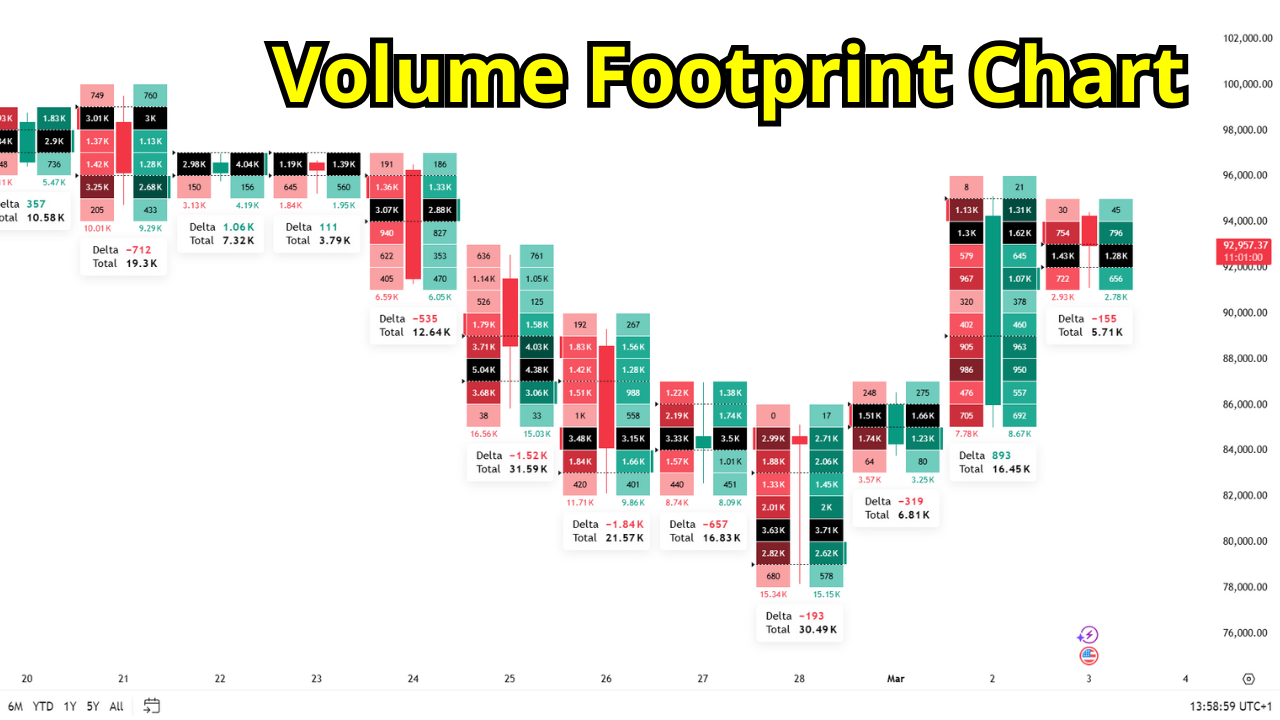
A Bitcoin volume footprint chart showing price candles with internal volume data. Green numbers represent buying volume and red numbers represent selling volume at each price level. Black highlights indicate the Point of Control (POC) where most trading occurred.
To access volume footprint charts in TradingView:
Open a clean chart in TradingView
Click on the "Candles" button in the upper left of your chart
Scroll down to "Volume Footprint" and select it
Important note: Volume footprint charts require a TradingView Premium subscription. If you want to try before committing, you can use TradingView Premium free for 30 days through trial offers.
For optimal viewing, I recommend:
Using a zoomed-in chart view
Trading instruments with sufficient liquidity (major cryptocurrencies, forex pairs, popular stocks)
Starting with larger timeframes until you become comfortable with interpretation
The most crucial concept to understand about volume footprint charts is that they display buying and selling pressure. Let's break down the components:
Each candle on a volume footprint chart contains two types of data:
Green values - Buying volume (aggressive buyers taking from the ask)
Red values - Selling volume (aggressive sellers hitting the bid)
This information reveals which side is controlling price action at specific levels. When buying volume exceeds selling volume at a price level, it indicates bullish pressure. Conversely, when selling volume dominates, it signals bearish pressure.
To understand this intuitively, think about the bid-ask spread:
Buying volume occurs when buyers are aggressive enough to pay the ask price, pushing price upward
Selling volume happens when sellers are aggressive enough to sell at the bid price, pushing price downward
One of the most powerful metrics in volume footprint analysis is Delta - the difference between buying and selling volume.
For each price level and each candle, Delta tells you which side dominated:
Positive Delta (green) - More buying than selling volume (bullish)
Negative Delta (red) - More selling than buying volume (bearish)
What makes Delta fascinating is that it can sometimes contradict the candle's color. For example, you might see a green candle (price closed higher than it opened) but with a negative Delta (more selling volume than buying). This divergence often signals weakness in the move and potential reversal.
Two other critical elements to understand:
Point of Control (POC) - The price level where the most volume traded during the candle's formation. On volume footprint charts, this appears as a black or highlighted row. POC identifies the most accepted price during that period.
Value Area - The price range where approximately 70% of the volume traded. This area is typically marked by small arrows or lines on the sides of the candle. The upper boundary is called Value Area High (VAH), and the lower boundary is Value Area Low (VAL).
These indicators help identify fair value zones where most participants agreed to transact. Price moves away from these areas often face resistance until new value areas form.
After experimenting with multiple configurations, I've found the following settings provide the clearest signals for both beginner and advanced traders:
Right-click anywhere on your chart and select "Settings"
Navigate to "Symbol" > "Volume Footprint"
Set Row Size to "Auto" (allows dynamic adjustment based on volatility)
Keep ATR Length at the default 14 (standard volatility measurement)
Change Type from "Buy & Sell" to "Delta" (simplifies reading by showing net pressure)
Maintain Value Area at 70% (standard industry practice)
Consider disabling Point of Control if you find the chart too cluttered
The "Delta" type setting is particularly powerful for beginners because it displays a single value (the difference between buying and selling volume) rather than separate columns. This makes it much easier to quickly identify which side is in control at each price level.
For advanced traders, you may prefer keeping the original "Buy & Sell" view to see the exact distribution, but most find the Delta view more efficient for quick decision-making.

My Recommended Volume Footprint Settings in TradingView: My Recommended Volume Footprint Settings in TradingView: Select 'Delta' type (red arrow) with ATR length at 14 and Value Area at 70%. This configuration streamlines your analysis by showing net buying/selling pressure with a single value at each price level instead of separate columns.
Now that we understand how to read volume footprint charts, let's examine practical trading strategies you can implement immediately:
The fundamental principle of volume footprint trading is alignment between price movement and volume direction:
Strong Bullish Signal: Upward price movement + positive Delta (more buying volume)
Strong Bearish Signal: Downward price movement + negative Delta (more selling volume)
Weak/Suspicious Move: Price movement in one direction with Delta in the opposite direction
When price and volume align, the move is more likely to continue. When they diverge, prepare for potential reversal or consolidation.
Volume footprint charts excel at validating breakouts by revealing whether institutional money supports the move:
Identify a key resistance or support level
Wait for price to approach the level
Monitor Delta as price tests the level
Enter after breakout only if Delta supports the direction of the break
Let me share a real example from Bitcoin's price action:
Bitcoin had repeatedly tested a key resistance level, forming higher lows in the process (a bullish sign). When price finally broke through resistance, the volume footprint showed massive buying pressure (positive Delta) confirming buyers were in control. This volume confirmation made the breakout much more reliable than price action alone would suggest.
Volume footprint charts can help identify potential reversals before they become obvious on regular charts:
Watch for price making new highs/lows but with declining Delta in that direction
Look for significant "absorption" - price levels where one side (buying or selling) absorbs the other side's pressure
Pay attention to hammer or shooting star candles with opposite Delta than expected
A perfect example occurred recently with Bitcoin. The price was moving downward, forming what appeared to be a bearish continuation pattern. However, the volume footprint showed positive Delta throughout much of the decline - buyers were actually absorbing the selling pressure. This positive Delta during a price decline signaled weakness in the bearish move, and indeed, price soon reversed upward.
The foundation of successful footprint trading lies in alignment between price action and Delta:
Validate breakouts with Delta confirmation before entering:
Spot reversals before they become obvious:
Volume footprint charts are most powerful when combined with traditional technical analysis, especially market structure. Here's how to integrate them:
Identify key support/resistance levels using traditional methods
Zoom in on these levels using volume footprint charts
Analyze the volume profile as price interacts with these levels
Look for volume confirmation or divergence at these critical points
This combined approach allows you to not just see that price is testing a support level, but to understand exactly how buyers and sellers are behaving during that test - giving you a significant edge in predicting the outcome.
While powerful, volume footprint charts come with challenges:
Information overload - Focus on Delta first until you're comfortable before analyzing every detail
Low-liquidity instruments - Volume footprint is less reliable on thinly traded assets
Overreliance on volume alone - Always combine with price action and market structure
Timeframe mismatches - Make sure your volume footprint timeframe matches your trading horizon
Volume profile shows accumulated volume at price levels across a selected time period, while volume footprint shows buying/selling volume at each price level within individual candles. Volume profile gives you a bigger picture view across multiple candles, while footprint charts provide granular insight into the buying/selling battle within each specific candle.
Yes, volume footprint works on all timeframes, though it tends to be more reliable on higher timeframes (1-hour and above) where patterns have more significance. Lower timeframes can become noisy with less institutional activity, making signals harder to interpret accurately.
No, volume footprint charts are primarily available on advanced platforms like TradingView Premium, NinjaTrader, and similar professional trading software. Most free platforms and basic subscriptions don't offer this advanced chart type as it requires complex data processing.
Volume footprint is most effective in highly liquid markets like major cryptocurrencies, forex, futures, and large-cap stocks. It's less reliable in thinly traded markets where limited volume can create misleading signals and make interpretation more difficult.
While no indicator can predict reversals with certainty, volume footprint often shows divergences between price and volume before major reversals, giving traders early warning signals. When price moves in one direction but Delta shows strength in the opposite direction, it can indicate a potential reversal ahead.
Volume footprint charts offer traders a significant advantage by revealing the underlying buying and selling pressure driving price action. By understanding who's in control at each price level, you gain insights that traditional candlestick charts simply can't provide.
Start by focusing on the basics - identifying positive vs. negative Delta and watching for alignment with price movement. As you become more comfortable, incorporate Point of Control and Value Area into your analysis. Finally, combine volume footprint with solid market structure recognition for a truly powerful trading approach.
Remember that like any tool, volume footprint charts aren't perfect predictions - they're probability enhancers. Use them wisely as part of a complete trading strategy that includes proper risk management.
Have you tried using volume footprint charts in your trading? What insights have they given you that traditional charts missed? Share your experiences in the comments below!
Ready to take your trading to the next level? Check out our comprehensive volume trading course that builds on these concepts and provides step-by-step trading systems for consistent results.
Master the essential volume indicators and discover how to use volume analysis to confirm price movements and predict market shifts.
Learn to identify key market turning points using structure breaks and character changes, perfect for combining with volume footprint analysis.
Explore the fundamentals of price action trading and discover how combining it with volume footprint charts creates a powerful analytical framework.
Learn how Fair Value Gaps provide precise entry opportunities and how to confirm them using volume footprint patterns for better trade execution.
(Limited Time: Save 70% Today!)
Unlock cutting-edge trading strategies with InvestingPro.
Access advanced charting tools and premium features.
Join Bybit for high-leverage crypto trading opportunities.
I bought my first stock at 16, and since then, financial markets have fascinated me. Understanding how human behavior shapes market structure and price action is both intellectually and financially rewarding.
I’ve always loved teaching—helping people have their “aha moments” is an amazing feeling. That’s why I created Mind Math Money to share insights on trading, technical analysis, and finance.
Over the years, I’ve built a community of over 200,000 YouTube followers, all striving to become better traders. Check out my YouTube channel for more insights and tutorials.