
How to Add Moving Averages in TradingView
Learn how to set up and customize moving averages on your charts to identify trends and potential entry points.
Last Updated: March 25, 2025
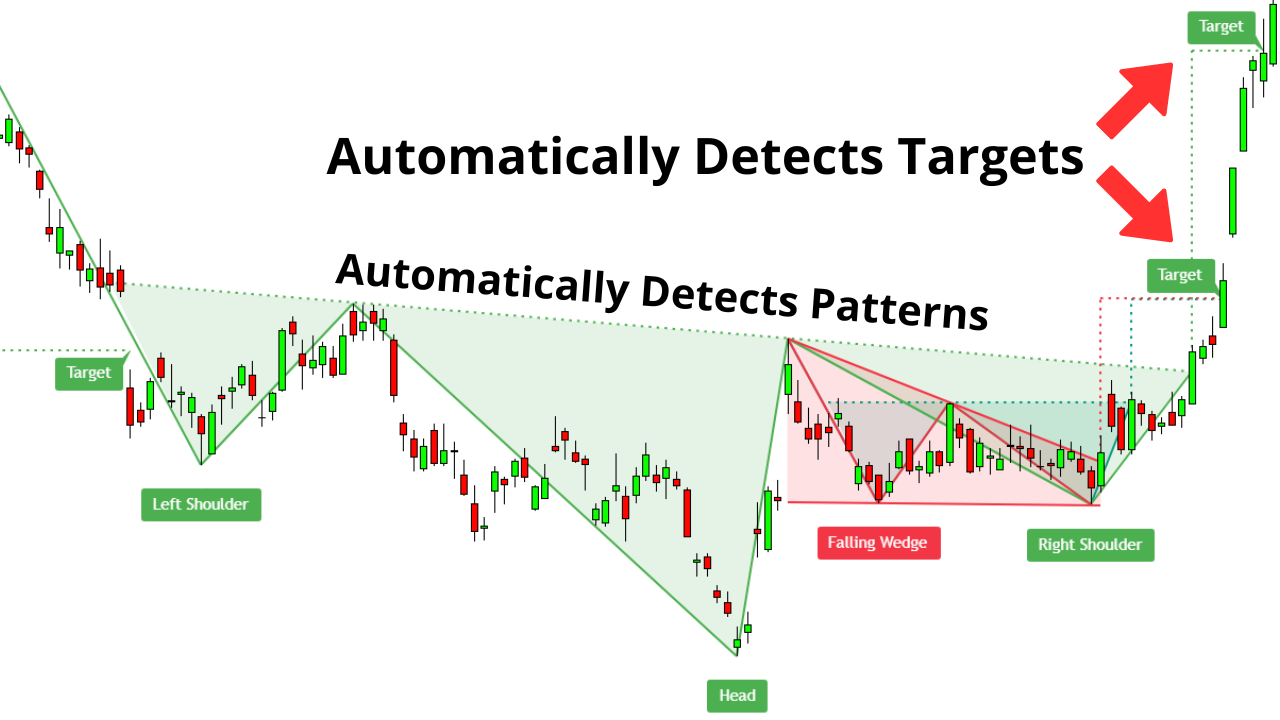
The Auto Chart Patterns Indicator automatically identifies key chart patterns like head and shoulders, double tops, wedges, and more, saving you time and reducing human error
The indicator calculates potential price targets based on identified patterns, giving you clear entry and exit points for your trades
Setting up the indicator is straightforward with customizable options for pattern selection, in-progress pattern display, and visibility preferences
Combining the Auto Chart Patterns Indicator with other TradingView tools like RSI and ATR creates a more comprehensive trading strategy with improved accuracy
To maximize effectiveness, stay selective with patterns, combine with fundamental analysis, and regularly update your settings as market conditions change
In the ever-evolving world of trading, having the right tools at your fingertips can make all the difference between success and missed opportunities. TradingView, a leading charting platform, offers tons of indicators designed to enhance your trading experience. Among these, the Auto Chart Patterns TradingView Indicator stands out as a powerful ally for traders looking to improve and simplify their technical analysis.
In this comprehensive guide, we'll delve into how this indicator can improve your trading, explore its features, and provide actionable insights on integrating it into your trading routine.
For visual learners, watch this video on the Mind Math Money YouTube channel. In this video, you will learn everything you need to know about the Auto Chart Patterns TradingView Indicator.
The Auto Chart Patterns Indicator is a sophisticated tool developed by TradingView to automatically detect various chart patterns on your trading charts. This indicator simplifies the process of pattern recognition, allowing traders to focus more on strategy execution rather than manual analysis.
Automatic Pattern Detection: Identifies a wide range of chart patterns, including head and shoulders, double tops and bottoms, wedges, and more.
Price Targets: Calculates potential price targets based on the identified patterns, providing clear entry and exit points.
Customizable Settings: Allows traders to select specific patterns for detection and customize the display according to their preferences.
The Auto Chart Patterns Indicator in TradingView
Chart patterns can be an important part of technical analysis, offering insights into potential future price movements based on historical data. Manually identifying these patterns can be tedious and error-prone. The Auto Chart Patterns Indicator streamlines this process, offering several benefits:
Efficiency: Saves time by automating the detection of complex patterns.
Accuracy: Reduces human error in pattern recognition.
Strategic Advantage: Enhances your ability to anticipate market movements and make informed trading decisions.
To make the most of this indicator, follow these straightforward steps to set it up on your TradingView platform:
Access TradingView: Log in to your account. You need to sign up for TradingView Premium to unlock the indicator. Use this link to try TradingView Premium for free for 30 days.
Open Your Preferred Chart: Select the asset you're interested in analyzing. For illustration, we'll use Tesla (TSLA) on a daily timeframe.
Add the Indicator:
Click on the "Indicators" tab at the top of the chart.
In the search bar, type "All Chart Patterns".
Select the indicator titled "All Chart Patterns" from the list.
Customize the Indicator Settings:
Click on the settings gear icon next to the indicator's name.
Under the "Patterns" section, choose the specific chart patterns you want the indicator to detect (e.g., double top, double bottom, head and shoulders).
In the "In Progress" tab, opt to display patterns currently forming if desired.
Under "Visibility", decide whether to show all patterns or only the most recent ones.
Click "OK" to apply your settings.
Analyze the Identified Patterns:
The indicator will display the detected patterns directly on your chart.
Price targets and breakout points will be clearly marked, aiding in your analysis.
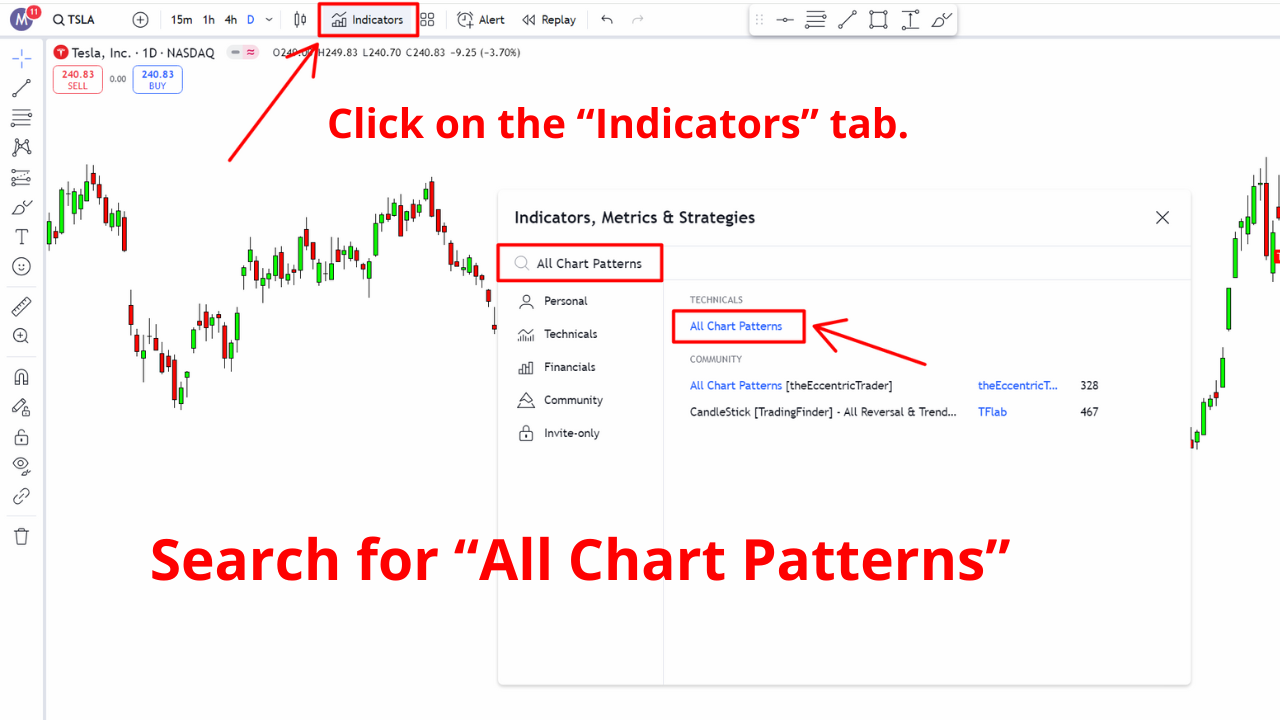
How to Set Up the Auto Chart Patterns Indicator on TradingView step-by-step.
To demonstrate the practical utility of the Auto Chart Patterns Indicator, let's examine a real-world example involving Tesla's stock:
Pattern Identified: The indicator detected an Inverse Head and Shoulders pattern on Tesla's daily chart.
Pattern Breakdown:
Left Shoulder: The stock forms a low point.
Head: A lower low follows, forming the "head" of the pattern.
Right Shoulder: A higher low completes the pattern.
Outcome:
Upon breaking the neckline, Tesla's price surged upward.
The indicator's calculated price target was reached swiftly, validating the pattern's predictive power.
This example highlights how the indicator not only identifies profitable patterns but also provides actionable price targets, enhancing your trading decisions.

Inverse Head and Shoulders Pattern Entry and Exit
While the Auto Chart Patterns Indicator is powerful on its own, combining it with other indicators can further improve your trading accuracy:
Relative Strength Index (RSI): Helps confirm momentum and overbought or oversold conditions.
Average True Range (ATR): Assists in understanding market volatility, aiding in setting stop-loss and take-profit levels.
Trend Confirmation: Use the Auto Chart Patterns Indicator to identify a continuation pattern like a falling wedge.
Signal Confirmation: Apply a price action technique like candlestick patterns to validate entry points.
Risk Management: Employ an indicator like the ATR to set appropriate stop-loss levels, ensuring you manage your risk effectively.
By integrating these tools, you create a robust trading strategy that leverages the strengths of multiple indicators.
It's important to note that the Auto Chart Patterns Indicator requires a TradingView Premium subscription. Upgrading unlocks this and other advanced features, giving you a competitive edge in your trading.
By signing up through our special affiliate link, you can try TradingView Premium free for 30 days. If you choose to continue after the trial, you'll receive a $15 bonus towards your plan. This offer not only grants you access to the Auto Chart Patterns Indicator but also supports our continued efforts to provide valuable content.
Stay Selective: Focus on patterns that align with your trading strategy and time frame.
Combine with Fundamental Analysis: While technical indicators are powerful, considering fundamental factors can provide a more comprehensive market view.
Regularly Update Your Settings: As market conditions change, adjust the indicator settings to remain aligned with current trends.
No, the Auto Chart Patterns indicator requires a TradingView Premium subscription. It's one of the advanced features that comes with the paid plans. You can try TradingView Premium free for 30 days using our special link mentioned in the article.
The indicator can identify a wide range of chart patterns including head and shoulders, inverse head and shoulders, double tops, double bottoms, triple tops, triple bottoms, wedges (rising and falling), triangles (ascending, descending, and symmetrical), rectangles, and flags. You can customize which patterns you want it to detect in the settings.
The Auto Chart Patterns indicator is quite accurate in identifying formed patterns, but like any technical tool, it isn't perfect. It's best used as one component of a comprehensive trading strategy rather than in isolation. When combined with other indicators and proper analysis, it significantly improves trading decisions. The accuracy also depends on the timeframe and asset being analyzed.
The Auto Chart Patterns indicator can be used for both day trading and swing trading. For day trading, you might want to use it on shorter timeframes (5-minute, 15-minute charts) to identify intraday patterns. For swing trading, it works well on daily and weekly charts to spot longer-term setups. Just remember to adjust your settings based on your trading style and timeframe preference.
To determine which patterns to trust, consider these factors: 1) Look for patterns that align with the overall trend, 2) Prioritize patterns with clear volume confirmation, 3) Focus on patterns that form at key support/resistance levels, 4) Consider patterns that have completed rather than those still forming, and 5) Verify the pattern with at least one other indicator. Additionally, patterns that appear on higher timeframes tend to be more reliable than those on very short timeframes.
The Auto Chart Patterns TradingView Indicator is a great tool for traders seeking to enhance their technical analysis capabilities. By automating the detection of key chart patterns and providing clear price targets, it simplifies the trading process and helps you make more informed decisions.
Whether you're a seasoned trader or just starting, incorporating this indicator into your trading arsenal can significantly improve your market insights and trading outcomes.
Learn how to set up and customize moving averages on your charts to identify trends and potential entry points.
Master the art of drawing Fibonacci levels and discover the golden zone for high-probability trading setups.
Compare TradingView's subscription plans and find out which features provide the best value for your trading needs.
Learn how to leverage the Relative Strength Index to identify overbought and oversold conditions across multiple markets.
I bought my first stock at 16, and since then, financial markets have fascinated me. Understanding how human behavior shapes market structure and price action is both intellectually and financially rewarding.
I’ve always loved teaching—helping people have their “aha moments” is an amazing feeling. That’s why I created Mind Math Money to share insights on trading, technical analysis, and finance.
Over the years, I’ve built a community of over 200,000 YouTube followers, all striving to become better traders. Check out my YouTube channel for more insights and tutorials.