
RSI Divergence Trading Strategy: Forex, Crypto, and Stock Trading
Master the powerful RSI divergence strategy to spot high-probability reversal points across all markets.
Last Updated: March 24, 2025
The RSI (Relative Strength Index) is a momentum oscillator that measures the speed and change of price movements on a scale from 0 to 100
RSI readings above 70 indicate overbought conditions (potential reversal down), while readings below 30 indicate oversold conditions (potential reversal up)
RSI divergences (when price and RSI move in opposite directions) can signal potential trend reversals and provide powerful trading opportunities
For more reliable trading signals, combine RSI with other technical indicators, price action, and market structure rather than using it in isolation
Adjusting the RSI period (default is 14) can optimize it for different timeframes: shorter periods (e.g., 7) for day trading and longer periods (e.g., 21) for swing trading
Technical indicators are essential tools that help traders make better decisions. One of the most popular indicators is the Relative Strength Index (RSI). Whether you’re an experienced trader or just getting started, understanding how the RSI works can improve your trading strategies.
In this guide, we'll explain what the RSI is, how it works, and how you can use it in your trading. We’ll cover important topics like overbought and oversold conditions, RSI momentum, and simple trading strategies. By the end, you’ll know how to use the RSI to boost your trading.
If you are a visual learner, check out this video on the Mind Math Money YouTube channel.
The Relative Strength Index (RSI) is a momentum oscillator that measures the speed and change of price movements. Developed by J. Welles Wilder Jr., the RSI oscillates between zero and 100 and is used to identify overbought or oversold conditions when trading assets like stocks, forex, and cryptocurrencies.

The RSI Indicator (Relative Strength Index) is a momentum indicator
The RSI indicator evaluates the relative strength of an asset's recent gains to its recent losses over a specified period, typically 14 periods. This calculation results in a value that fluctuates between 0 and 100. Traders use these values to assess the momentum of price movements and identify potential reversal points.
Before diving deeper into the RSI, it's essential to understand what momentum means in trading. Momentum refers to the velocity of price movements. It indicates how strong or fast a price is moving, which can help traders anticipate future movements.
Momentum can be classified into four categories:
Strong Bullish Momentum: When prices rise rapidly, and the size of the candlestick bodies is significantly larger than previous candles.
Weak Bullish Momentum: When prices are increasing, but the movement is slow, and candlestick bodies are small.
Strong Bearish Momentum: When prices fall rapidly, and candlestick bodies are significantly larger than previous candles.
Weak Bearish Momentum: When prices are decreasing slowly with small candlestick bodies.
Additionally, sometimes the market may exhibit neutral momentum, where prices move sideways without a clear direction.

Bullish RSI Momentum and Bearish RSI Momentum
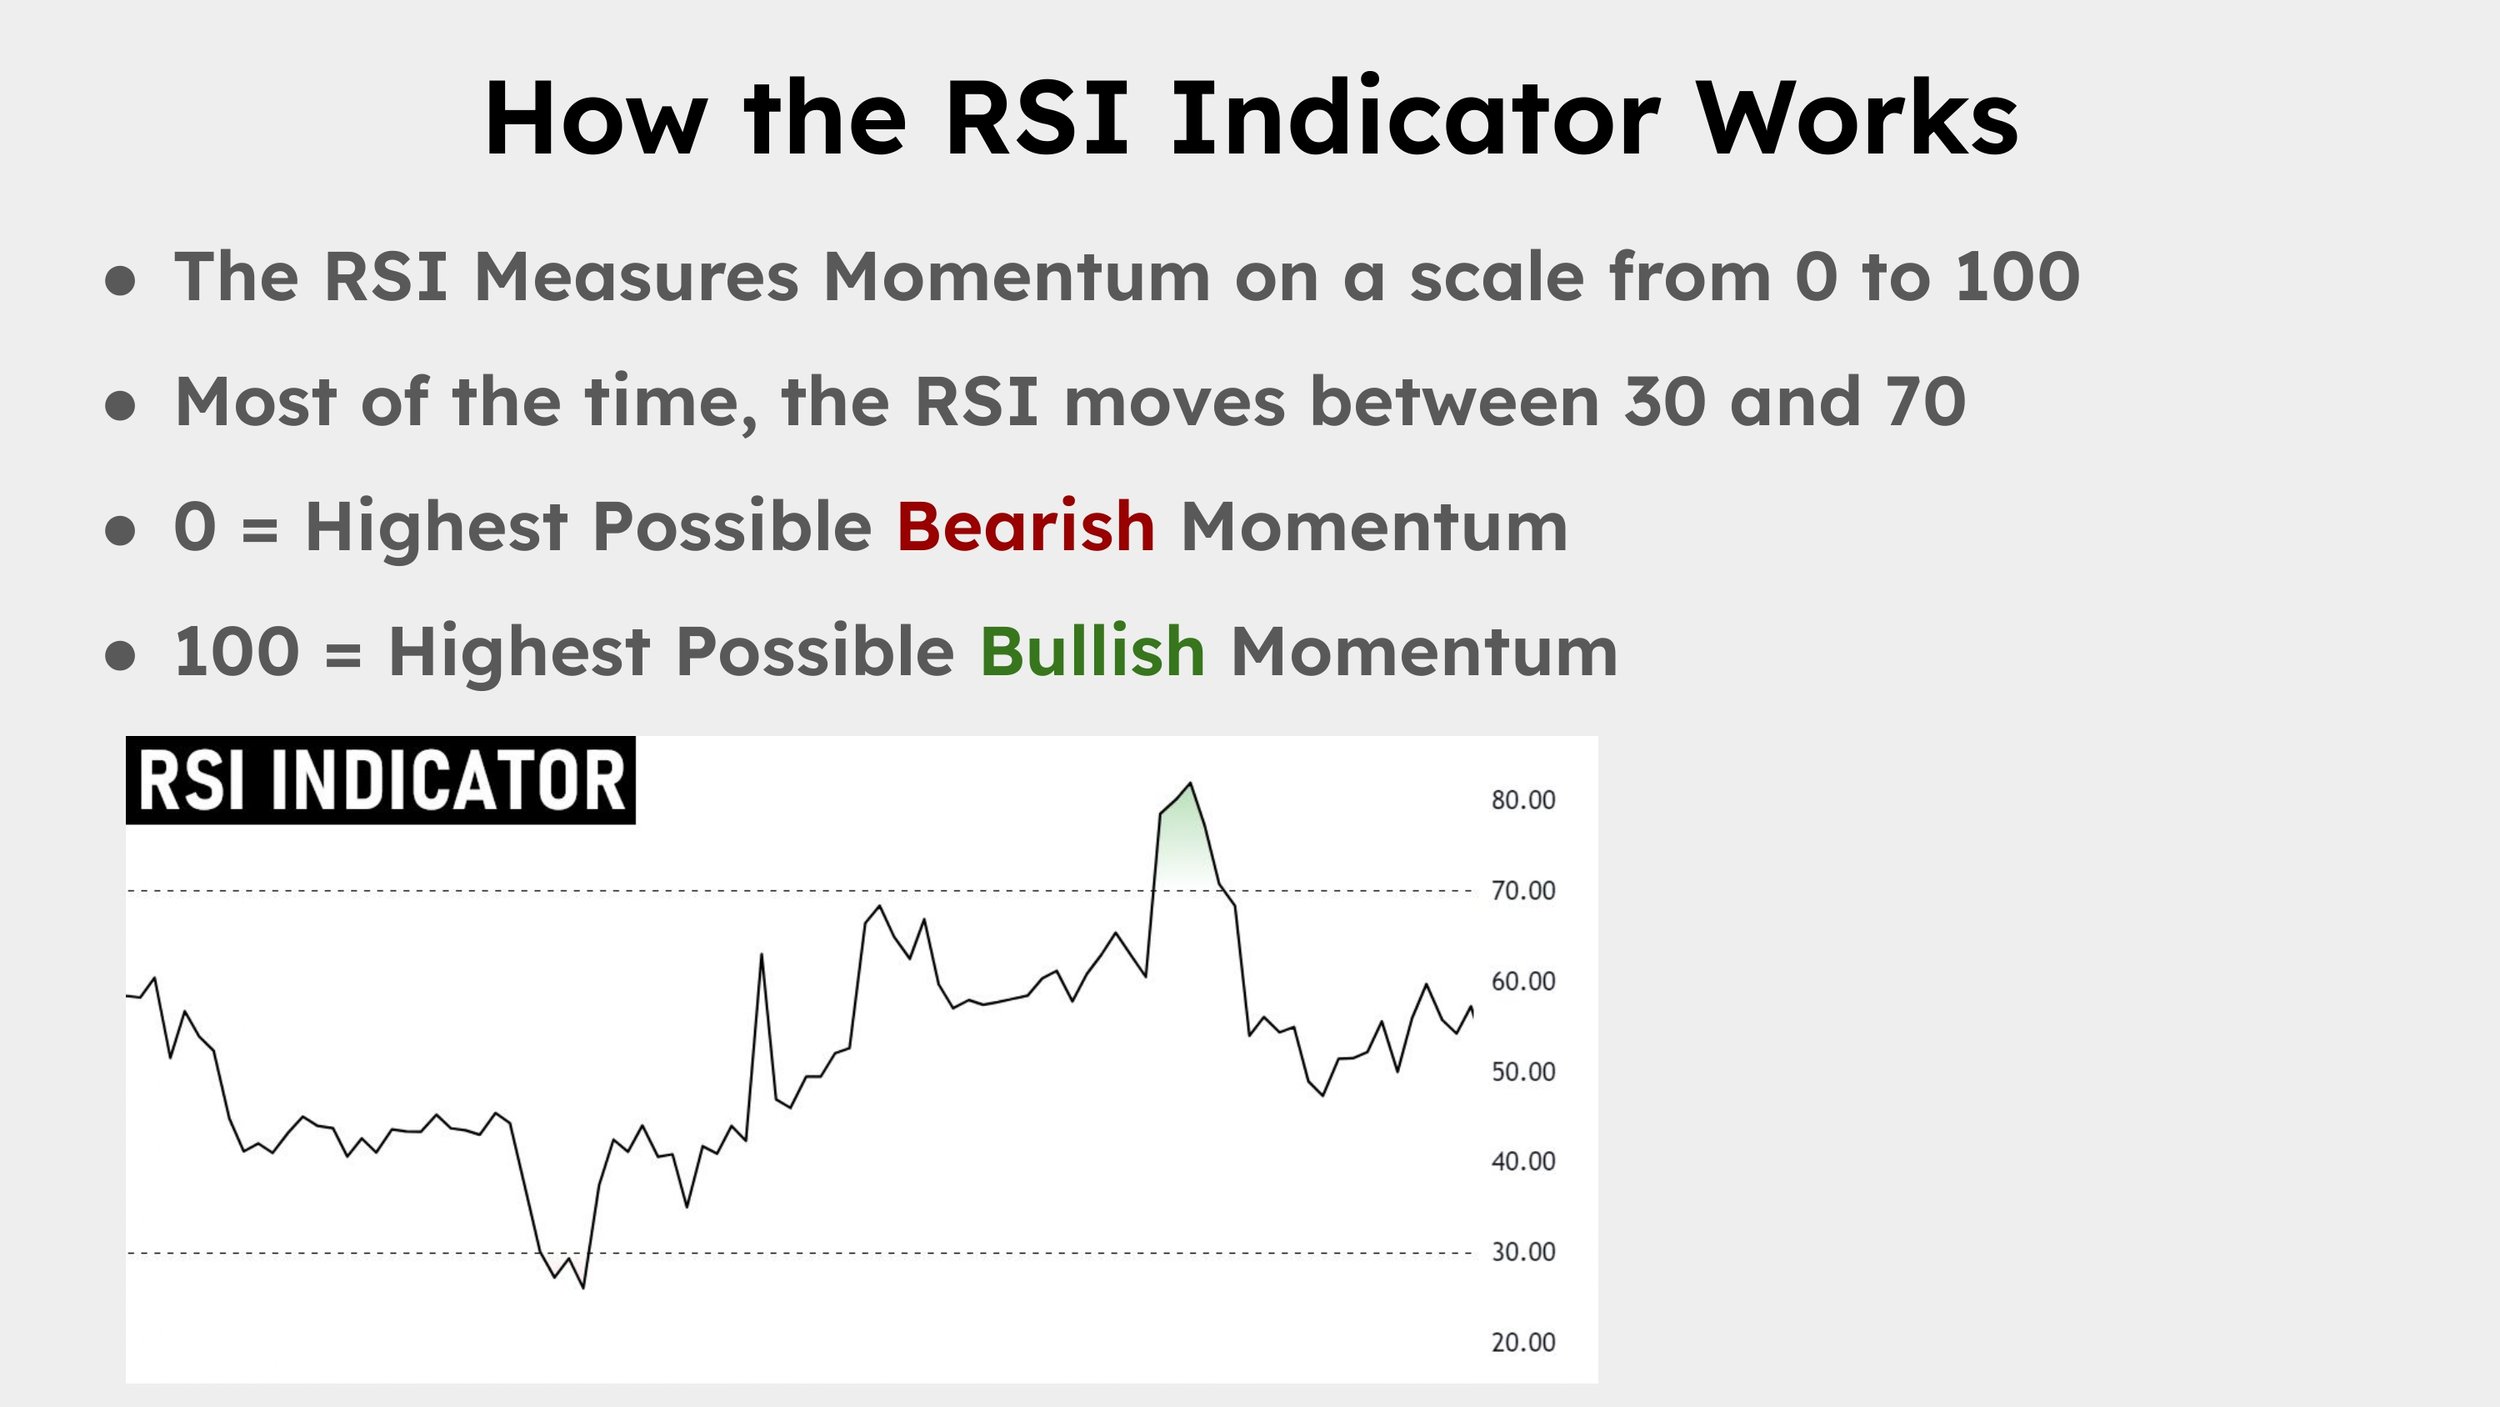
The RSI measures momentum on a scale from 0 to 100:
Above 70: The asset is considered overbought, indicating strong bullish momentum.
Below 30: The asset is considered oversold, indicating strong bearish momentum.
Between 30 and 70: The asset is considered to be in a neutral momentum state.
The RSI rarely reaches the extreme values of 0 or 100. In most cases, it oscillates within the 30 to 70 range. However, during strong trends, the RSI can push above 70 or below 30, signaling potential overbought or oversold conditions.
How does the RSI Indicator work?
RSI Above 70 (Overbought): This suggests that the asset has experienced significant upward momentum and may be due for a price correction or pullback.
RSI Below 30 (Oversold): This indicates that the asset has experienced significant downward momentum and may be due for a rebound or upward reversal.
Overbought and oversold are terms used to describe extreme market conditions:
Overbought: When an asset's price has risen sharply to a level considered too high or unsustainable. The RSI reading above 70 signals this condition.
Oversold: When an asset's price has fallen sharply to a level considered too low or undervalued. The RSI reading below 30 signals this condition.
It's important to note that overbought does not necessarily mean the price will drop immediately, nor does oversold mean the price will rise right away. These conditions can persist during strong trends.

RSI Overbought and Oversold
Many traders mistakenly believe that overbought conditions are automatic sell signals and oversold conditions are automatic buy signals. However, relying solely on these signals are risky and unproductive.
Overbought in Uptrends: In strong uptrends, the RSI can remain overbought for extended periods as the price continues to rise. Selling solely because the RSI is overbought can result in missed profit opportunities.
Oversold in Downtrends: In strong downtrends, the RSI can remain oversold as the price continues to fall. Buying solely because the RSI is oversold can lead to losses if the downtrend persists.
It's crucial to consider the broader market context and use additional indicators or analysis to confirm potential reversal signals provided by the RSI.
To effectively use the RSI indicator, considerthe following trading strategies:
Look for divergences between the RSI and the price movement:
Bullish Divergence: Occurs when the price makes a lower low, but the RSI makes a higher low. This suggests weakening bearish momentum and a potential upward reversal.
Bearish Divergence: Occurs when the price makes a higher high, but the RSI makes a lower high. This indicates weakening bullish momentum and a potential downward reversal.

RSI Bullish Divergence, Hidden Bullish Divergence, Bearish Divergence, and Hidden Bearish Divergence.
Use the RSI to confirm the strength of a trend:
Uptrend Confirmation: During an uptrend, the RSI tends to stay above 50 and often bounces off the 40-50 range.
Downtrend Confirmation: During a downtrend, the RSI tends to stay below 50 and often bounces off the 50-60 range.
While not a standalone signal, overbought and oversold conditions can highlight potential opportunities:
Overbought Strategy: In a downtrend, overbought RSI readings can signal potential entry points for short positions.
Oversold Strategy: In an uptrend, oversold RSI readings can signal potential entry points for long positions.
Enhance the reliability of RSI signals by combining them with other technical indicators, such as:
Moving Averages: To identify the overall trend direction.
Support and Resistance Levels: To find potential entry and exit points.
Candlestick Patterns: For additional confirmation of reversals.
You find and use all these indicator in TradingView.
Here's an example of how you might incorporate the RSI into a trading strategy:
Use the standard 14-period RSI on a daily chart.
Long Position:
Look for Bullish RSI Divergence
Confirm with market structure or price action.
Short Position:
Look for Bearish RSI Divergence
Look for market structure or price action signals to confirm.
Set a stop loss below the recent swing low for long positions or above the recent swing high for short positions to manage risk.
Consider setting a take profit level at the next significant support or resistance level.
Alternatively, use a risk-reward ratio, such as 1:2 or 1:3.
Never risk more than a small percentage of your trading capital on a single trade.
Use proper position sizing based on your account size and risk tolerance.
While the default RSI period is 14, you may adjust it to suit your trading style:
Short-Term Trading: Use a shorter period (e.g., 7) for more sensitive RSI readings, suitable for day trading or scalping.
Long-Term Trading: Use a longer period (e.g., 21) for smoother RSI readings, suitable for swing trading or investing.
Experimenting with different settings can help you find the most effective configuration for the assets you trade.
The RSI indicator is versatile and applicable across various markets:
Identifying Stocks Due for a Reversal: Use the RSI indicator to find stocks that may be overextended and due for a correction.
Earnings Reports: Be cautious around earnings releases, as they can cause significant price movements that impact RSI readings.
Currency Pairs: Apply the RSI to major and minor currency pairs to spot potential reversals or continuations.
Economic News: Forex markets are sensitive to economic data; consider fundamental analysis alongside RSI signals.
High Volatility: Cryptocurrencies can exhibit extreme price swings; the RSI can help identify overbought or oversold conditions in these volatile markets.
Adjusting Sensitivity: You may need to adjust RSI settings to account for the higher volatility in crypto markets.
Avoid Using RSI in Isolation: Always combine RSI signals with other technical analysis tools, like price action and market structure, for better reliability.
Be Mindful of False Signals: In choppy or sideways markets, the RSI may produce false overbought or oversold signals.
Stay Updated on Market News: Fundamental factors can impact price movements; be aware of news events that could affect your trades.
Practice Risk Management: Use stop losses and position sizing to protect your trading capital.
For day trading, a shorter RSI period of 7-9 is often more effective as it creates a more responsive indicator that can capture short-term price movements. This helps day traders identify quick momentum shifts and potential entry/exit points. However, the optimal setting depends on your trading style and the specific asset you're trading.
RSI can help identify potential market reversals, especially through divergences (when price moves in one direction while RSI moves in the opposite direction). However, it should not be used as the sole predictor. For more reliable reversal signals, confirm RSI readings with other technical indicators, price action patterns, and market structure analysis.
While RSI, Stochastic, and MACD are all momentum indicators, they calculate momentum differently. RSI measures the ratio of average gains to average losses, Stochastic compares the closing price to the price range over a specific period, and MACD tracks the relationship between two moving averages. RSI tends to be less volatile than Stochastic and more responsive to price changes than MACD, making it useful for different market conditions.
No, you should not automatically sell when RSI moves above 70. During strong uptrends, RSI can remain in overbought territory (above 70) for extended periods while prices continue to rise. Instead of using overbought levels as immediate sell signals, look for additional confirmation such as bearish divergences, candlestick patterns, or a break of trend structure before considering a sell position.
Yes, RSI can be effectively used for cryptocurrency trading, but you may need to adjust the settings due to crypto's higher volatility. Many crypto traders use RSI to identify potential reversals and divergences. However, cryptocurrencies can remain in overbought or oversold conditions longer than traditional markets, so it's particularly important to use RSI in combination with other indicators and analysis methods when trading crypto.
The Relative Strength Index (RSI) is a powerful tool that measures momentum and helps traders identify overbought and oversold conditions. By understanding how the RSI indicator works and incorporating it into your trading strategies, you can make more informed decisions and potentially improve your trading performance.
Remember that while the RSI provides valuable insights, it's essential to use it alongside other analysis methods and risk management techniques. Markets are complex, and no single indicator can guarantee success.
By mastering the RSI and staying disciplined in your trading approach, you'll be better equipped to navigate the markets and capitalize on trading opportunities.
Master the powerful RSI divergence strategy to spot high-probability reversal points across all markets.
Learn about another powerful momentum indicator that works well in conjunction with RSI.
Discover how professional trader Linda Raschke combines momentum indicators for consistent profits.
Explore the "volume-weighted RSI" that adds another dimension to momentum analysis.
(Limited Time: Save 70% Today!)
Unlock cutting-edge trading strategies with InvestingPro.
Access advanced charting tools and premium features.
Join Bybit for high-leverage crypto trading opportunities.
I bought my first stock at 16, and since then, financial markets have fascinated me. Understanding how human behavior shapes market structure and price action is both intellectually and financially rewarding.
I’ve always loved teaching—helping people have their “aha moments” is an amazing feeling. That’s why I created Mind Math Money to share insights on trading, technical analysis, and finance.
Over the years, I’ve built a community of over 200,000 YouTube followers, all striving to become better traders. Check out my YouTube channel for more insights and tutorials.