
Break of Structure (BoS) and Change of Character (CHoCH) Trading Strategy
Master the core concepts of BoS and CHoCH to identify key turning points in the market and enhance your top-down analysis.
Last Updated: March 26, 2025
Top-down analysis combines multiple time frames to provide a comprehensive view of the market, starting from higher time frames to identify overall trends, then moving to lower time frames for precise entry points.
A ratio of 4:1 to 8:1 between time frames provides optimal analysis—for example, using Daily (high), 4-hour (medium), and 30-minute (low) charts for a swing trading approach.
Price action analysis within the top-down framework focuses on market structure, candlestick patterns, and support/resistance interactions to identify high-probability trading setups.
Integrating Smart Money Concepts (SMC) with top-down analysis helps identify institutional activity through liquidity zones, order flow analysis, and important market structures.
Multi-time frame analysis confirms trends across different timeframes, filters out false signals, and enhances overall trading strategy effectiveness by providing a complete market context.
Top-down analysis is a powerful technical analysis technique that combines multiple time frames and tools to provide a comprehensive understanding of the forex, crypto or stock market. By analyzing higher, medium, and lower time frames, traders can identify trends, key support and resistance levels, and precise entry and exit points. In this guide, we'll delve into the intricacies of top-down analysis in trading, providing a step-by-step approach to help you enhance your trading strategies.
Watch Top Down Analysis Trading Strategy (Day Trading & Swing Trading) on YouTube!
Top-down analysis involves examining the market from a broader perspective and gradually narrowing down to finer details. It starts with analyzing higher time frames to understand the overall market direction and trend, then moves to medium time frames for more detailed insights, and finally to lower time frames for precise trade execution.
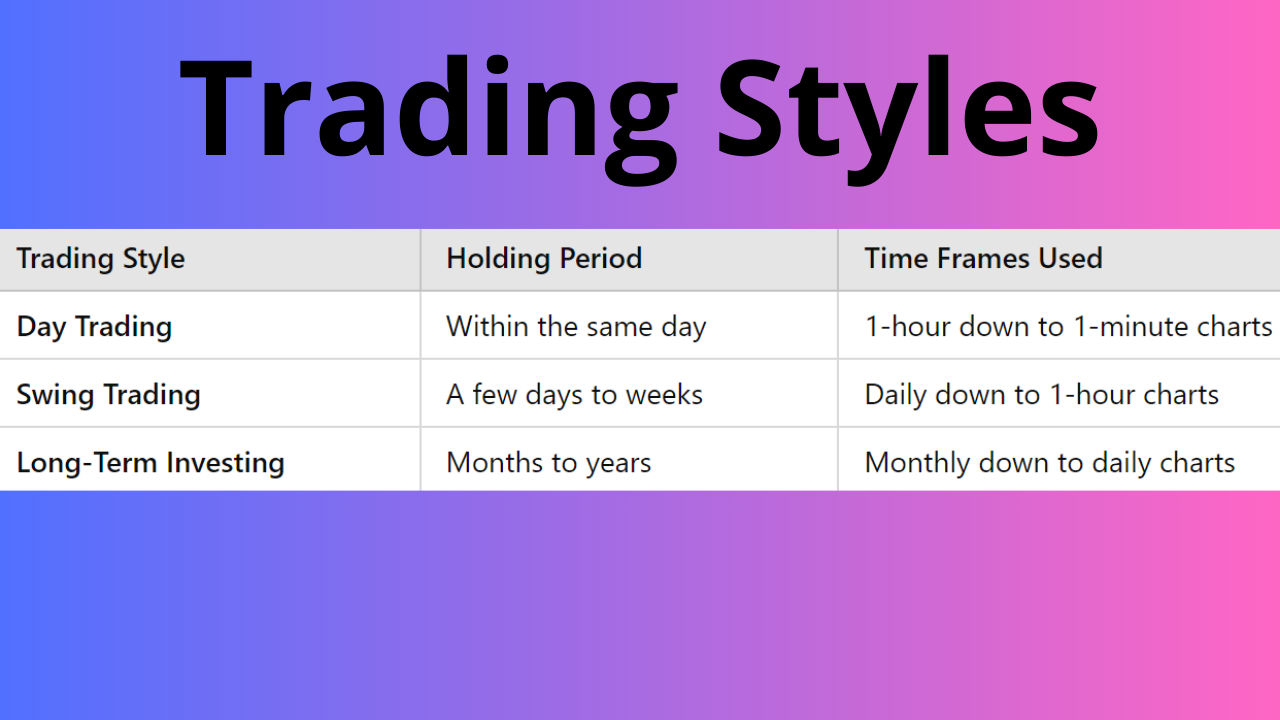
Time frames are essential in technical analysis, representing the period each candlestick on a chart covers. Different trading styles utilize various time frames:
Day Trading: Involves buying and selling within the same day, using lower time frames such as 1-hour down to 1-minute charts.
Swing Trading: Positions are held from a few days to weeks, using medium time frames like daily down to 1-hour charts.
Long-Term Investing: Positions are held for months to years, using higher time frames like monthly down to daily charts.
Understanding and selecting the appropriate time frames is crucial for effective top-down analysis.
Day Trading vs Swing Trading vs Long-Term Investing
Selecting the right combination of time frames ensures a cohesive and effective analysis. A good practice is to use a ratio of 4:1 to 8:1 between time frames. For example:
High Time Frame: Daily chart (each candlestick represents one day)
Medium Time Frame: 4-hour chart
Low Time Frame: 30-minute chart
This combination allows for a comprehensive view of the market, from overall trends to precise entry points. When selecting time frames, it's essential to use a charting platform that allows for easy navigation between different periods. TradingView, for instance, provides an intuitive interface where you can seamlessly switch between time frames and customize your analysis according to your trading style.

Best Time Frames for Trading Top-Down Analysis
In this section, we'll provide a top-down analysis forex step-by-step guide to help you implement this approach effectively.
Identify Market Direction: Determine whether the market is in an uptrend, downtrend, or ranging. Look for patterns of higher highs and higher lows (uptrend) or lower highs and lower lows (downtrend). To learn more about this, read my article about market structure.
Spot Key Support and Resistance Levels: Mark significant levels where the price has previously reversed or consolidated. These levels are crucial for anticipating future price movements.
Assess Momentum and Divergences: Use indicators like the Relative Strength Index (RSI) or Moving Average Convergence Divergence (MACD) to evaluate market momentum and identify potential divergences that may signal trend reversals.
Refine Key Levels: Adjust support and resistance levels based on more recent price action. This provides a clearer picture of immediate market dynamics.
Analyze Market Structure: Examine swing highs and lows to understand the market's behavior. Identifying breakouts or breakdowns in structure can signal potential trading opportunities.
Identify Chart Patterns: Look for formations such as head and shoulders, double tops/bottoms, or trend channels that may indicate future price movements.
Pinpoint Entry and Exit Points: Use price action trading strategies and candlestick patterns for precise trade execution. Patterns like pin bars, engulfing candles, or inside bars can provide actionable signals.
Evaluate Volume and Market Orders: Analyze volume indicators and order flow to confirm trade setups. Increased volume on breakout moves can validate the strength of a trend.
Monitor Momentum: Utilize shorter-term indicators to gauge immediate market sentiment and potential reversals.

Top Down Analysis Trading Strategy
Price action top-down analysis involves focusing on the movement of price over time to make trading decisions. This method relies less on lagging indicators and more on real-time market data.
Market Structure Analysis: Understanding the formation of swing highs and lows helps in identifying trends and potential reversal points.
Candlestick Patterns: Recognizing patterns like doji, hammers, or shooting stars can provide early signals for trade opportunities.
Support and Resistance Interaction: Observing how price behaves at key levels can indicate the strength or weakness of these zones.
Multi time frame analysis is examining an asset across different time frames to get a well-rounded view of its behavior. This approach helps in:
Confirming Trends: Ensuring that the trend on the higher time frame aligns with that on the lower time frames.
Avoiding False Signals: By cross-referencing signals across time frames, traders can filter out noise and reduce the likelihood of false entries.
Enhancing Strategy Effectiveness: Combining insights from multiple time frames can lead to more robust trading decisions.
Incorporating multi time frame price action techniques can allow traders to see the bigger picture while still focusing on actionable details.
Let's walk through a practical example of applying top-down analysis to a forex pair.
Trend Identification: The overall trend is upward, with a series of higher highs and higher lows.
Key Levels: Resistance identified at 1.2000 and support at 1.1800.
Momentum Indicators: RSI is above 50, indicating bullish momentum.
Refined Levels: Price has recently retraced to the 1.1800 support level.
Chart Patterns: A bullish engulfing pattern forms near support.
Market Structure: The formation of a higher low suggests potential continuation of the uptrend.
Entry Signals: A breakout above minor resistance at 1.1820 with increased volume.
Candlestick Patterns: Confirmation with a bullish pin bar.
Trade Execution: Enter a long position with a stop-loss below the recent swing low at 1.1790 and a target near the previous high at 1.2000.
Disclaimer: The example provided above is purely hypothetical and for educational purposes only. Always ensure to do your own analysis and due diligence before making any trading decisions. Trading involves risk, and past performance is not indicative of future results.
SMC trading strategies focus on understanding the actions of institutional traders, often referred to as "smart money." By integrating SMC into top-down analysis, traders can:
Identify Liquidity Zones: Spot areas where institutional traders are likely to enter or exit positions, such as previous highs and lows.
Understand Order Flow: Analyze how large orders impact price movements, providing insights into potential future price action.
Align with Market Movers: Position trades in the direction of institutional activity for higher probability setups.
Combining SMC with top-down analysis can enhance your ability to anticipate significant market moves.
Utilizing reliable charting tools is essential for conducting thorough top-down analysis. Platforms like TradingView offer a user-friendly interface with advanced features:
Customizable Time Frames: Easily switch between different time frames to analyze the market comprehensively.
Drawing Tools: Mark up charts with trend lines, support and resistance levels, and annotations.
Technical Indicators: Apply a wide range of indicators to assess momentum, volume, and other market factors.
If you're not already using TradingView, it's worth exploring its features. The platform offers a free version with extensive capabilities, and upgrading to a premium account unlocks even more tools that can enhance your analysis.
Top-down analysis is a comprehensive technical analysis approach that examines markets across multiple time frames, starting with a higher time frame to identify the overall trend direction, then moving to medium and lower time frames to pinpoint specific entry and exit points. This hierarchical approach helps traders understand both the big picture market movement and the precise timing for trade execution.
The best time frames for top-down analysis typically follow a 4:1 to 8:1 ratio between them. For example, a common combination for swing traders is Daily (high time frame), 4-hour (medium time frame), and 30-minute (low time frame) charts. Day traders might use 4-hour, 1-hour, and 5-minute charts. The specific time frames you choose should align with your trading style—shorter for day trading and longer for swing or position trading.
Price action is a crucial component of top-down analysis as it focuses on the raw movement of price without relying heavily on indicators. Within a top-down framework, price action techniques help traders analyze market structure (patterns of highs and lows), interpret candlestick patterns, and observe how price interacts with support and resistance levels. These observations across multiple time frames provide powerful insights into potential future price movements and optimal entry points.
Yes, top-down analysis can be effectively applied to all financial markets, including forex, cryptocurrencies, stocks, commodities, and indices. The principles of analyzing multiple time frames to understand trend direction and market structure remain consistent across markets. However, each market may have unique characteristics that traders should consider, such as volatility patterns, liquidity profiles, and trading session dynamics.
Smart Money Concepts (SMC) integrates with top-down analysis by focusing on institutional trading activity across different time frames. When using top-down analysis with SMC, traders identify key liquidity zones on higher time frames where institutions might be positioning themselves, then use medium and lower time frames to spot order flow patterns, fair value gaps, and liquidity grabs. This combined approach helps retail traders align their positions with institutional money movements for potentially higher-probability trades.
Top-down analysis is a comprehensive approach that empowers traders to make informed decisions by considering the market from multiple perspectives. By integrating multi time frame analysis, price action strategies, and understanding market structure, traders can enhance their trading performance.
Whether you're a novice trader or an experienced one looking to refine your strategies, incorporating top-down analysis into your routine can lead to more consistent and profitable trading outcomes. By following these steps, you can perform the best top-down analysis to potentially improve your trading results.
Master the core concepts of BoS and CHoCH to identify key turning points in the market and enhance your top-down analysis.
Learn how to classify price levels to find the highest probability trading opportunities when applying market structure analysis.
Discover how institutional traders hunt for liquidity and how you can incorporate these patterns in your top-down analysis strategy.
Explore how Fair Value Gaps provide precise entry opportunities when used as part of your multi-timeframe analysis approach.
These premium resources will help you implement the multi-timeframe strategies discussed in this article.
Perfect for Multi-Timeframe Analysis
Special Offer: $15 Bonus + 30 Days Free
Institutional-Level Market Analysis
Limited Time: 70% OFF Today!
Execute Your Top-Down Strategy
New Users: Up to $30,000 in Bonuses
I bought my first stock at 16, and since then, financial markets have fascinated me. Understanding how human behavior shapes market structure and price action is both intellectually and financially rewarding.
I’ve always loved teaching—helping people have their “aha moments” is an amazing feeling. That’s why I created Mind Math Money to share insights on trading, technical analysis, and finance.
Over the years, I’ve built a community of over 200,000 YouTube followers, all striving to become better traders. Check out my YouTube channel for more insights and tutorials.