
Linda Raschke Trading Strategy: MACD Indicator Settings for Trading Stocks, Forex and Crypto
Discover the professional MACD settings used by legendary trader Linda Raschke for consistent profits across multiple markets.
Last Updated: March 22, 2025
The MACD indicator consists of three key components: the MACD line (12-period EMA minus 26-period EMA), the signal line (9-period EMA of the MACD line), and the histogram (difference between MACD and signal lines)
MACD line crossing above the signal line generates a bullish signal, while crossing below indicates a bearish signal – these crossovers provide potential entry and exit points
The histogram visually represents momentum – larger bars indicate stronger momentum, while smaller bars suggest momentum is weakening
Watch for histogram divergence between price and MACD – if price makes higher highs but the histogram makes lower highs, it could signal a potential reversal
The zero line crossover helps identify broader trend shifts – MACD crossing above zero indicates a potential bullish trend, while crossing below suggests bearish momentum
In this guide, we’re going to dive into how the MACD indicator works, covering everything from the MACD line to the signal line and histograms. This article is perfect for traders who want a comprehensive understanding of the MACD and how to apply it in their trading strategies. Whether you’re into day trading, forex trading, or looking to improve your stock market performance, mastering the MACD indicator can give you an edge.
The MACD indicator is a popular tool used in technical analysis that helps traders identify trends, potential reversals, and momentum in a given asset. MACD stands for Moving Average Convergence Divergence, and the indicator consists of three main parts:
The MACD line
The signal line
The histograms
Let's break down each component and understand how they work together.
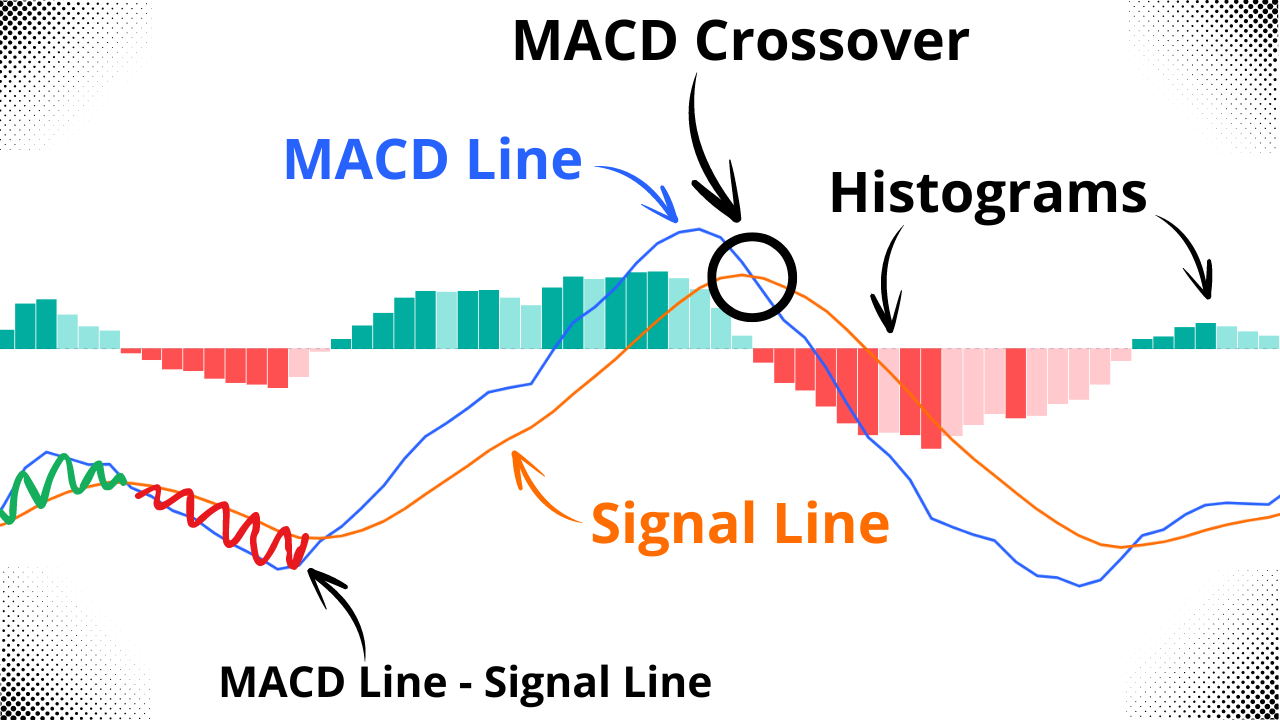
MACD Crossover, MACD Line, Signal Line, and MACD Histograms
The MACD line is the primary line of the indicator and is typically displayed in blue on most charting platforms like TradingView. It is calculated by taking the difference between two exponential moving averages (EMAs):
A short-term EMA (standard setting is 12 periods)
A longer-term EMA (standard setting is 26 periods)
In other words, the MACD line = 12-period EMA - 26-period EMA.
This calculation helps traders identify the momentum in the price of an asset, with positive values indicating upward momentum and negative values indicating downward momentum.

MACD Line
If you want to adjust the MACD line settings, most platforms allow you to change the number of periods used for the short-term and long-term EMAs. However, the standard 12, 26, 9 MACD settings are widely used and are effective for most trading strategies.
Next, we have the signal line, which is usually displayed in orange. The signal line is simply a 9-period simple moving average (SMA) of the MACD line. Because it's a moving average of the MACD line, it smooths out the data and gives a more clear indication of when trends might be changing.
One of the most common MACD trading strategies involves watching for crossovers between the MACD line and the signal line.
When the MACD line crosses above the signal line, it is typically seen as a bullish signal.
When the MACD line crosses below the signal line, it’s often viewed as a bearish signal.
These crossovers are easy to spot and provide great entry and exit points for trades.

MACD Signal Line
The histogram in the MACD represents the difference between the MACD line and the signal line. When the two lines are far apart, the histogram bars are larger. When the lines are close together or crossing, the histogram bars are smaller. The histogram helps traders visualize the momentum and strength of a move.
Positive histogram bars (above the zero line) indicate that the MACD line is above the signal line, showing upward momentum.
Negative histogram bars (below the zero line) indicate that the MACD line is below the signal line, showing downward momentum.
A common MACD histogram strategy is to look for divergence between the price of an asset and the MACD histogram. For example, if the price is making higher highs, but the histogram is making lower highs, it could signal a potential reversal.

MACD Histogram
The zero line (or MACD zero line) is the line that separates the positive and negative values of the MACD line and histograms. When the MACD line crosses the zero line, it signifies a key point in trend analysis.
MACD line crossing above the zero line: The 12-period EMA has crossed above the 26-period EMA, suggesting a potential bullish trend.
MACD line crossing below the zero line: The 12-period EMA has crossed below the 26-period EMA, indicating possible bearish momentum.
The zero line helps traders quickly determine whether an asset is in an overall uptrend or downtrend.

MACD Zero Line
The standard MACD settings (12, 26, 9) work well in many markets, but you can adjust the parameters to fit your specific needs. For day trading or forex trading, some traders prefer to use shorter EMAs (e.g., 8 and 21) to respond faster to price movements. On the other hand, longer EMAs (e.g., 50 and 200) are often used for longer-term trading.
Experiment with different settings on your charts to find what works best for your trading style.
The MACD crossover strategy is one of the most popular uses of this indicator. By focusing on the points where the MACD line crosses the signal line and the zero line, traders can time their entries and exits with more precision. Many traders combine the MACD with other indicators, such as RSI or Bollinger Bands, to confirm the strength of the signal.
For day trading, many traders prefer using faster MACD settings than the standard 12, 26, 9. Popular day trading MACD settings include 5, 13, 1 or 8, 17, 9. These faster settings are more responsive to short-term price movements, making them suitable for intraday trading decisions. However, the ideal settings may vary depending on your trading style and the specific asset you're trading.
Yes, MACD is excellent for swing trading. The standard settings (12, 26, 9) work well for identifying medium-term trends and potential reversal points that swing traders look for. Pay special attention to MACD crossovers and zero line crossings as they can signal the beginning of multi-day price movements. For swing trading, combining MACD with other indicators like RSI or support/resistance levels can improve your success rate.
While both are momentum indicators, they work differently. MACD measures the relationship between two moving averages, helping to identify trend direction and strength. RSI (Relative Strength Index) measures the speed and magnitude of price movements on a scale of 0-100, primarily identifying overbought or oversold conditions. MACD is better for trend following, while RSI excels at identifying potential reversal points. Many traders use both indicators together for confirmation.
The MACD is most reliable when used in trending markets and less effective in choppy, sideways markets where it can generate false signals. No indicator is 100% accurate. MACD signals should be confirmed with other technical analysis tools or price action. Research suggests the MACD performs better in strongly trending markets and when combined with additional confirmation signals. For best results, avoid using MACD in isolation.
To spot MACD divergence, look for situations where price movement contradicts the MACD indicator. Bullish divergence occurs when price makes lower lows, but the MACD makes higher lows (suggesting bullish momentum despite price decline). Bearish divergence happens when price makes higher highs, but MACD makes lower highs (suggesting weakening momentum despite price increase). Divergences are powerful signals of potential trend reversals, especially when they occur at support/resistance levels.
The MACD indicator is a versatile and powerful tool for traders in various markets. Whether you're trading stocks, forex, or crypto, the MACD line, signal line, and histograms can help you better understand market momentum and potential trend reversals.
To get the most out of the MACD, remember these key points:
Pay attention to histograms to gauge the strength of a move.
Watch the zero line to confirm the overall trend direction.
Pay attention to MACD divergence for potential reversals.
By mastering the MACD and integrating it into your trading strategy, you’ll be better equipped to make informed decisions and improve your trading performance. If you're ready to dive deeper into technical analysis, consider exploring our full trading course for more advanced strategies!
Discover the professional MACD settings used by legendary trader Linda Raschke for consistent profits across multiple markets.
Learn advanced MACD strategies with real examples, optimal settings, and practical trading techniques for today's markets.
A step-by-step tutorial on setting up and using the MACD indicator effectively on the TradingView platform.
Combine RSI divergence with MACD signals for a powerful trading approach that works across multiple markets.
(Limited Time: Save 70% Today!)
Unlock cutting-edge trading strategies with InvestingPro.
Access advanced charting tools and premium features.
Join Bybit for high-leverage crypto trading opportunities.
I bought my first stock at 16, and since then, financial markets have fascinated me. Understanding how human behavior shapes market structure and price action is both intellectually and financially rewarding.
I’ve always loved teaching—helping people have their “aha moments” is an amazing feeling. That’s why I created Mind Math Money to share insights on trading, technical analysis, and finance.
Over the years, I’ve built a community of over 200,000 YouTube followers, all striving to become better traders. Check out my YouTube channel for more insights and tutorials.