Understanding Fair Value Gaps (FVG) in Trading: An In-Depth Guide
Fair Value Gaps (FVG) are a core technique in Smart Money Concepts (SMC). In today’s blog post, you will learn everything you need to know about Fair Value Gaps. You will discover the difference between bullish and bearish Fair Value Gaps, how to identify them, the distinction between Fair Value Gaps and supply and demand zones, and much more.

How to Draw Fibonacci Extensions: Fibonacci Extension Levels, Targets and Trading Strategy
In this Fibonacci Extension trading guide, we delve into how to identify key target levels using Fibonacci extensions. Learn to pinpoint precise entry and exit points by recognizing swing highs and lows, and discover the significance of critical levels like 0.786, 1.0, and 1.618.

Free TradingView Premium: Is it Possible?
Is it possible to get TradingView Premium for free? In this blog post, you will discover how to obtain a free but limited-time TradingView Premium subscription. You will learn about the 30-day free TradingView Premium trial and the steps needed to unlock it, how to claim a $15 bonus towards new TradingView plans, and much more.

RSI Divergence Trading Strategy: Forex, Crypto, and Stock Trading
Discover the power of RSI Divergence in trading with our comprehensive guide. This article breaks down the four key types of divergence—bullish, bearish, hidden bullish, and hidden bearish—and explains how to use them effectively in forex, crypto, and stock markets. Perfect for beginners, our step-by-step approach and practical examples will help you master this essential trading strategy and improve your trading success.

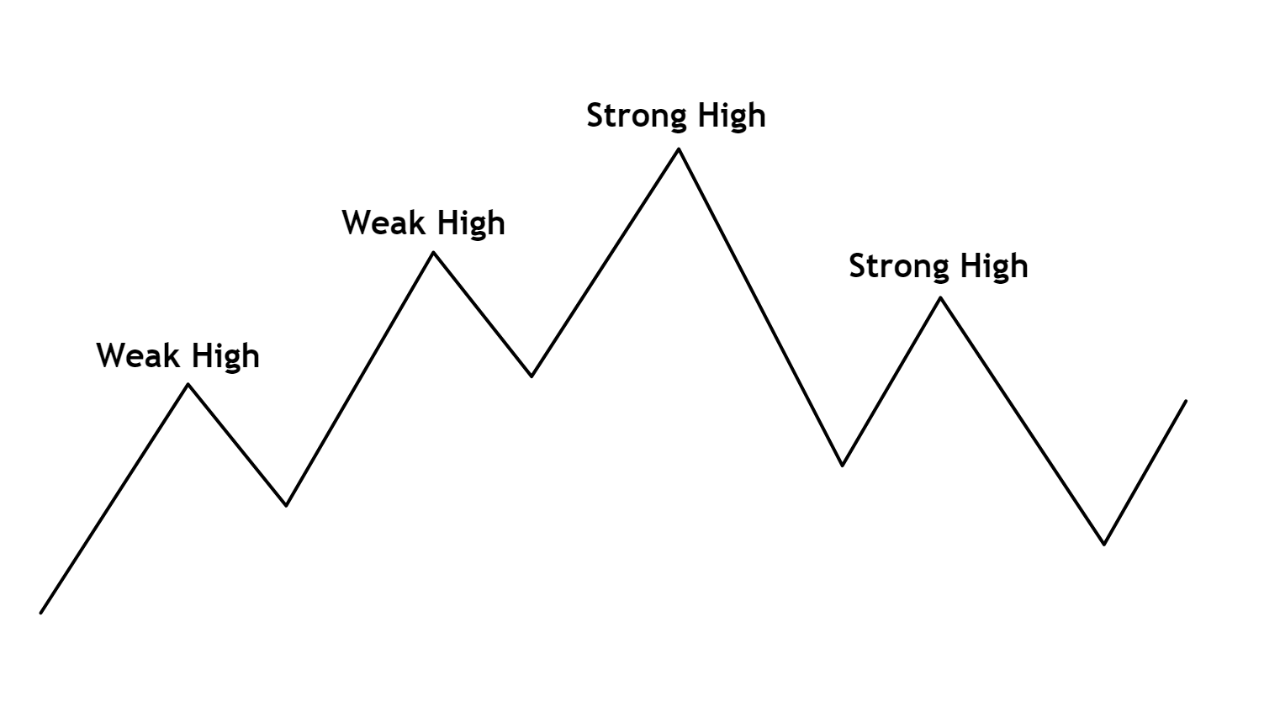
Understanding Strong Highs, Weak Highs, Strong Lows, and Weak Lows in Market Structure Trading
Navigating the complexities of market structure trading can be daunting, but mastering the concepts of strong and weak highs and lows can greatly enhance your strategy. This article simplifies these concepts, guiding you through their identification and implications for making smarter trading decisions. For visual learners, a comprehensive video explanation is also available on the Mind Math Money YouTube channel.

Trading Swing Highs and Swing Lows: An Essential Guide for Traders
Understanding market structure is crucial for trading success. In this guide, we explore a swing high swing low trading strategy, teaching you how to identify these key points on a chart. Learn how to determine trends, recognize Break of Structure (BOS) and Change of Character (CHOCH), and analyze real charts to improve your trading decisions.

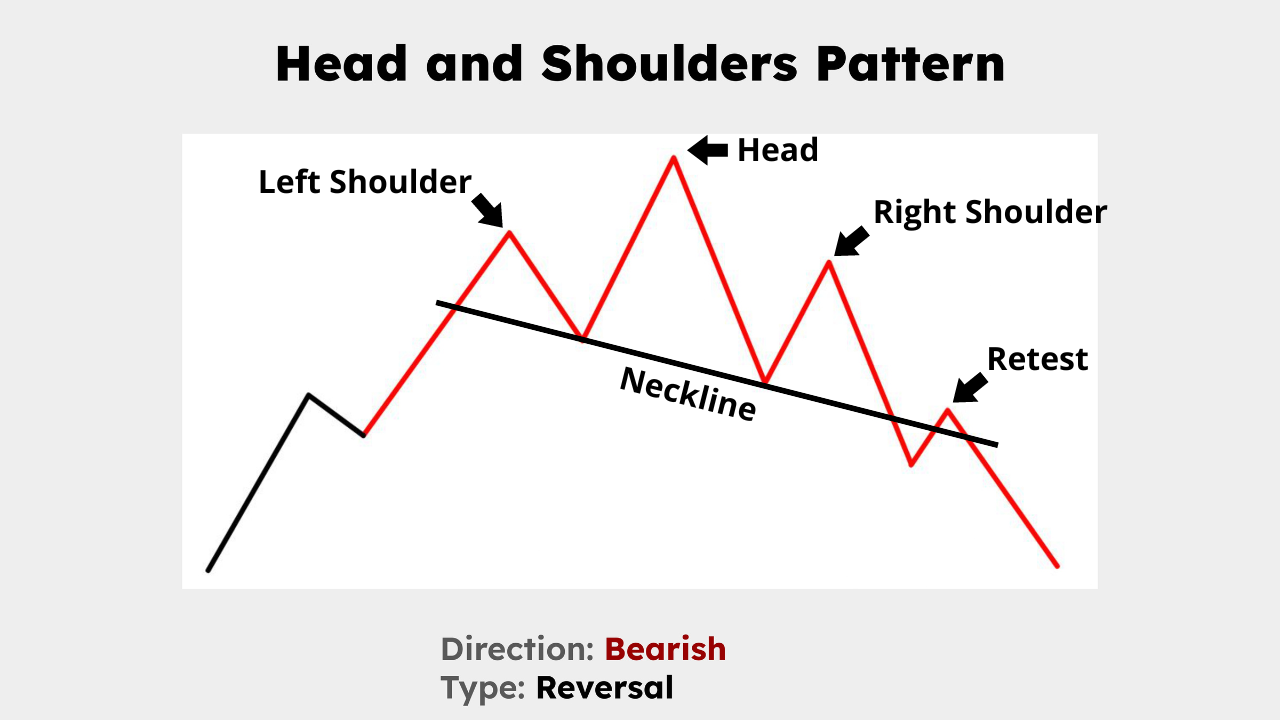
Understanding the Head and Shoulders Chart Pattern: A Comprehensive Guide
Unlock the secrets of the head and shoulders pattern, a crucial tool for spotting bearish reversals. This guide covers its structure, identification, and trading strategies, including entry points, stop loss placements and profit targets. Perfect for traders at any level, this article provides the insights needed to predict market trends effectively. Improve your trading skills with real market examples and expert tips.

Understanding Break of Structure (BOS) and Change of Character (CHOCH) in Trading
If you're aiming to improve your trading skills, learning about BOS (Break of Structure) and CHOCH (Change of Character) should be at the top of your list. This concise article not only explains what BOS and CHOCH are but also delves into why they are crucial for predicting market movements and making informed decisions.

How to Trade the Double Top and Double Bottom Pattern
Discover the power of the Double Top and Double Bottom chart patterns in this guide. These chart patterns offer clear signals for bullish and bearish reversals across forex, crypto, stock markets. They can be used whether you are day trading or swing trading.

Understanding the Simple Moving Average (SMA)
Discover the truth behind the Simple Moving Average (SMA) in our latest guide. Debunking common myths, we delve into the essence of SMAs, revealing how they're not about choosing the "best" number but understanding their strategic application in trading

Understanding Trading Order Types: A Beginner's Guide
This article delves into the basics of trading order types, offering a straightforward guide for beginners. We will cover the market order, buy limit, sell limit, and sell stop orders. Some advanced trading order types will also be discussed.

Overbought and Oversold in Trading: A Beginner's Guide
Learn about what overbought and oversold means in trading with this beginner-friendly guide. We will talk about the meaning of overbought and oversold but also how you can identify these conditions using the RSI indicator.

The RSI Indicator: How to Use the Relative Strength Index
Improve your trading game with a clear guide on using the Relative Strength Index (RSI Indicator) effectively. This article breaks down the basics, from correcting common misconceptions to applying the RSI strategies that professional traders use. Learn about the significance of RSI divergence, the integration of double-bottom patterns, and how to optimize RSI settings for better market analysis.

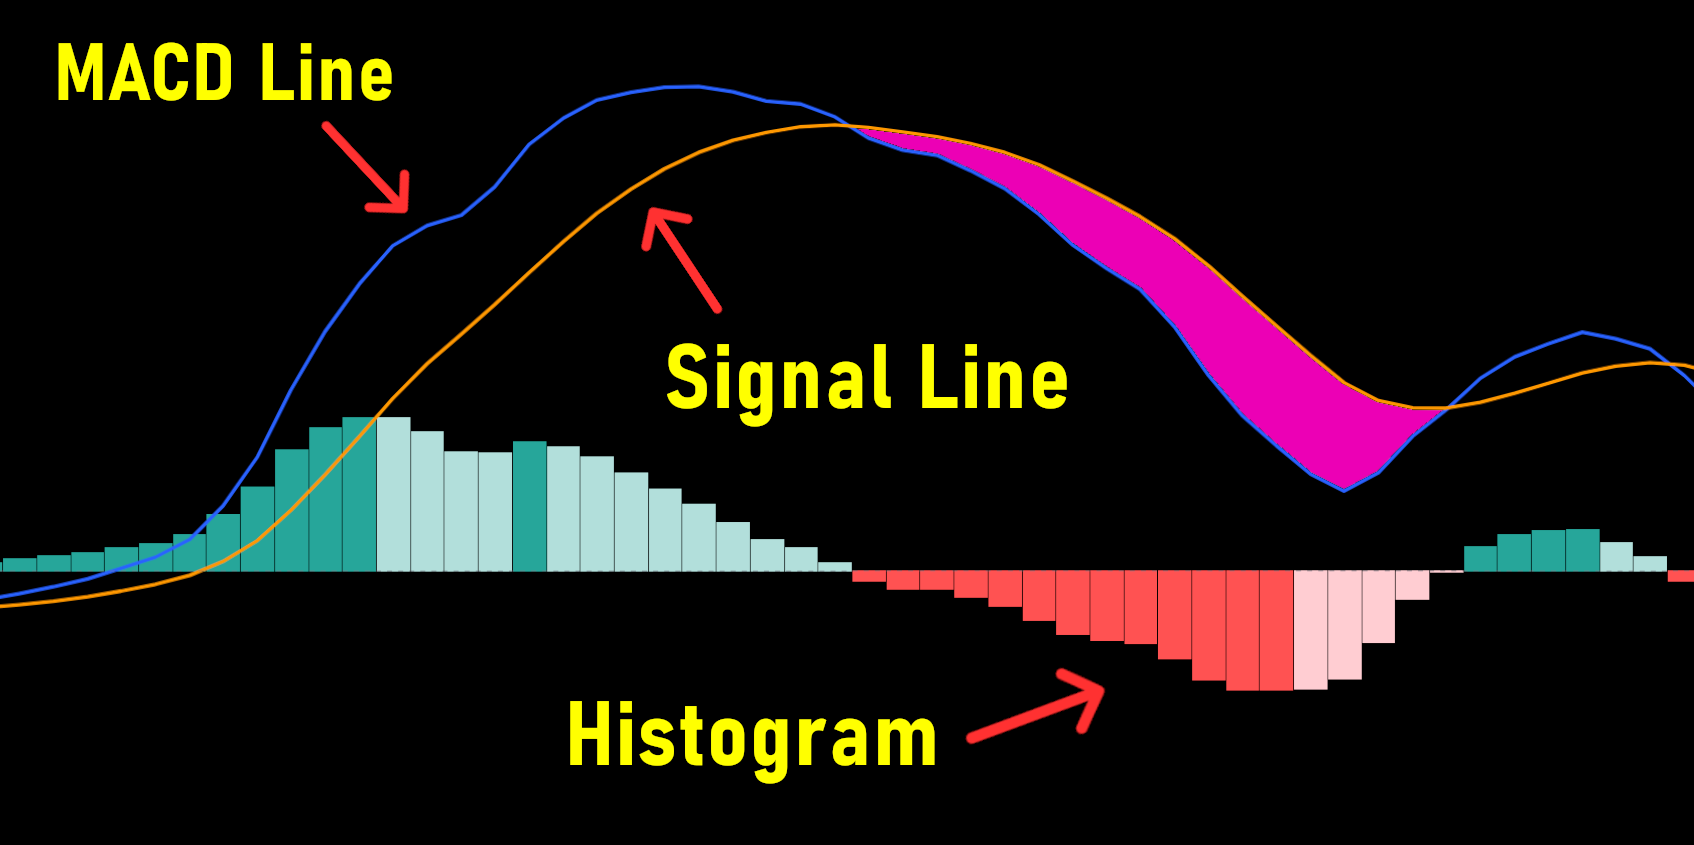
MACD Indicator Explained for Beginners
In this guide, we delve into the MACD (Moving Average Convergence Divergence), a trading indicator used to understand market trends and momentum. Beyond basics, it includes practical examples of MACD trading techniques. For beginners and seasoned traders, the MACD indicator is worth exploring!

How to Use the RSI Indicator in TradingView
Unlock the potential of the Relative Strength Index (RSI) in TradingView with our short guide. Discover how to effectively add and interpret this crucial momentum indicator to improve your trading. Learn the significance of overbought and oversold conditions and master the art of identifying RSI divergences for better market predictions. Whether you're a novice or an experienced trader, this guide can elevate your technical analysis skills. Dive in to explore the synergy of RSI with other indicators like the moving average for a more robust trading approach.

How To Add Moving Averages in Tradingview
Learn the simple steps to add Moving Averages in TradingView. Our guide takes you through the process, ensuring you can confidently apply both the simple moving average (SMA) and exponential moving average (EMA) to TradingView.
