
Best Day Trading Platforms of 2024: TradingView, Binance, Bybit, and More
Find out about the top day trading platforms of 2024. Whether you're trading crypto, stocks, or forex, this guide covers the best options, including TradingView, Binance, Bybit, and more.
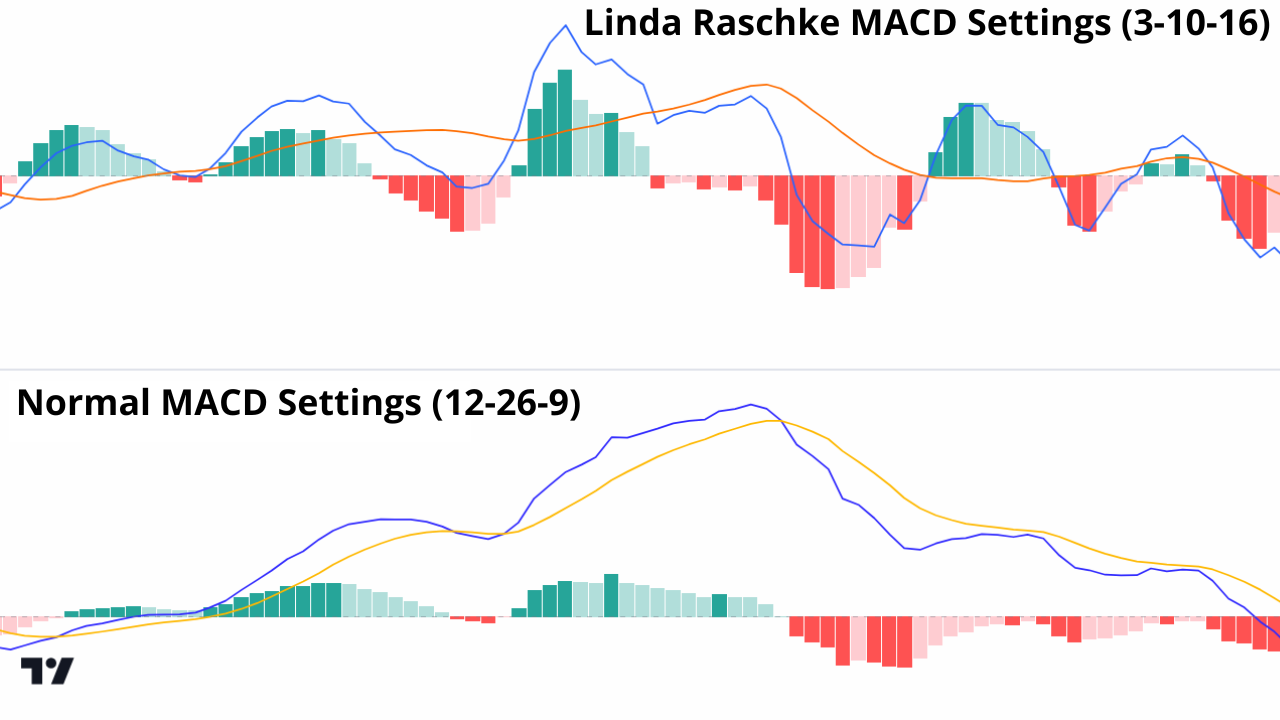
Linda Raschke Trading Strategy: MACD Indicator Settings for Trading Stocks, Forex, and Crypto
Did you know you can customize the MACD settings to potentially enhance its effectiveness in your trading? In this article, you'll discover Linda Raschke's MACD settings and how they differ from the standard setup. Plus, we'll guide you step-by-step on how to adjust these settings in TradingView.

Top Down Analysis in Forex, Crypto and Stock Trading: Price Action & Market Structure
Top-Down Analysis is a powerful technique used in forex, stock, and crypto trading. By analyzing higher, medium, and lower time frames, traders can identify trends, key support and resistance levels, and precise entry and exit points. In this article, you'll discover what top-down analysis is and how to use it effectively!

Stock Market Trading Terms Explained for Dummies: Stock Broker, Portfolio, Volatility, IPO, and More
If you're looking to trade or invest in stocks, understanding key stock market terms is essential. In this article, we'll break down some of the most important stock market terminology, explained simply and step-by-step, to help you navigate the market with confidence.
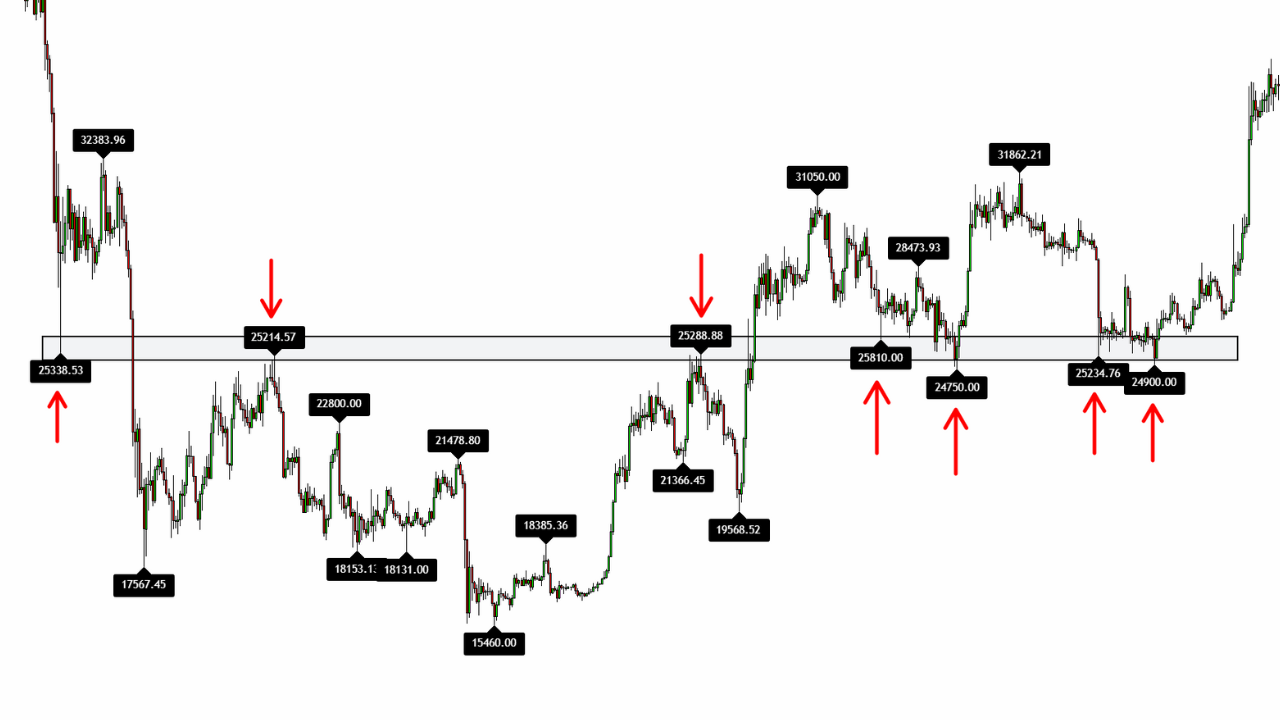
Support and Resistance TradingView Indicator: The Pivot Point Trading Strategy
The Pivot Points High and Low Indicator is one of the most effective tools on TradingView for identifying key support and resistance levels. In this article, you'll learn how to set it up and use it step-by-step to potentially improve your trading strategy.
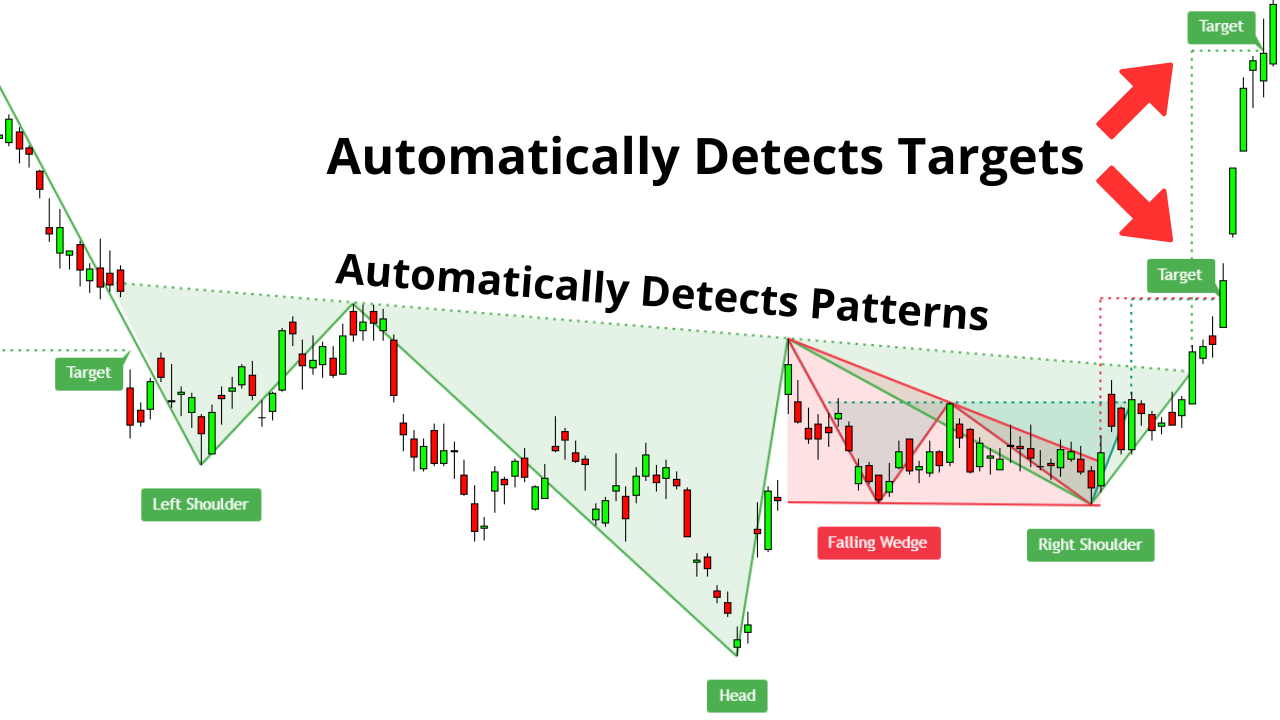
The Auto Chart Patterns TradingView Indicator: A Comprehensive Guide
The Auto Chart Patterns TradingView Indicator is one of the best built-in tools TradingView offers. In this comprehensive guide, you'll learn everything you need to know about the All Chart Patterns Indicator step-by-step.

The RSI Indicator: How to use the RSI Indicator (Relative Strength Index) for Trading Crypto, Forex, and Stocks.
In this article, you'll learn everything about the RSI Indicator (Relative Strength Index) — what it is, how it relates to momentum, RSI divergences, and much more!

Volume Analysis in Trading: A Guide to Volume Indicators and Strategies
Understanding volume analysis in trading is something you can't do without as a trader. In this article, we will break down what volume trading is, why it's important, and how to use the volume indicator together with price action signals to improve your trading strategies.

Fibonacci TradingView Settings: The Golden Zone
The Fibonacci Golden Zone is one of the best Fibonacci Retracement settings. In this article, you’ll learn how to set up the Fibonacci Golden Zone step-by-step.

What is Crypto? A Simple Guide to Understanding Cryptocurrency
Crypto has taken the world by storm, but many still wonder, "What is crypto?". In this blog post, you'll learn the basics of cryptocurrency, blockchains, nodes, Bitcoin, and more! Whether you're a beginner or looking to deepen your understanding of crypto, this article is for you!

Break of Structure (BOS) and Change of Character (CHOCH) Trading Strategy
What is the difference between Break of Structure (BOS) and Change of Character (CHOCH)? In this article, you'll explore BOS and CHOCH, understand why these concepts are crucial for traders, and learn the distinctions between internal and external BOS and CHOCH.

Understanding Smart Money Concepts (SMC) in Trading: A Comprehensive Guide
What is Smart Money Concepts in Trading? If you're looking to understand smart money concepts (SMC Trading), you've found the right article. In this blog post, you will learn how institutional investors like banks and hedge funds influence market movements and how we, as retail traders, can take advantage of these insights.
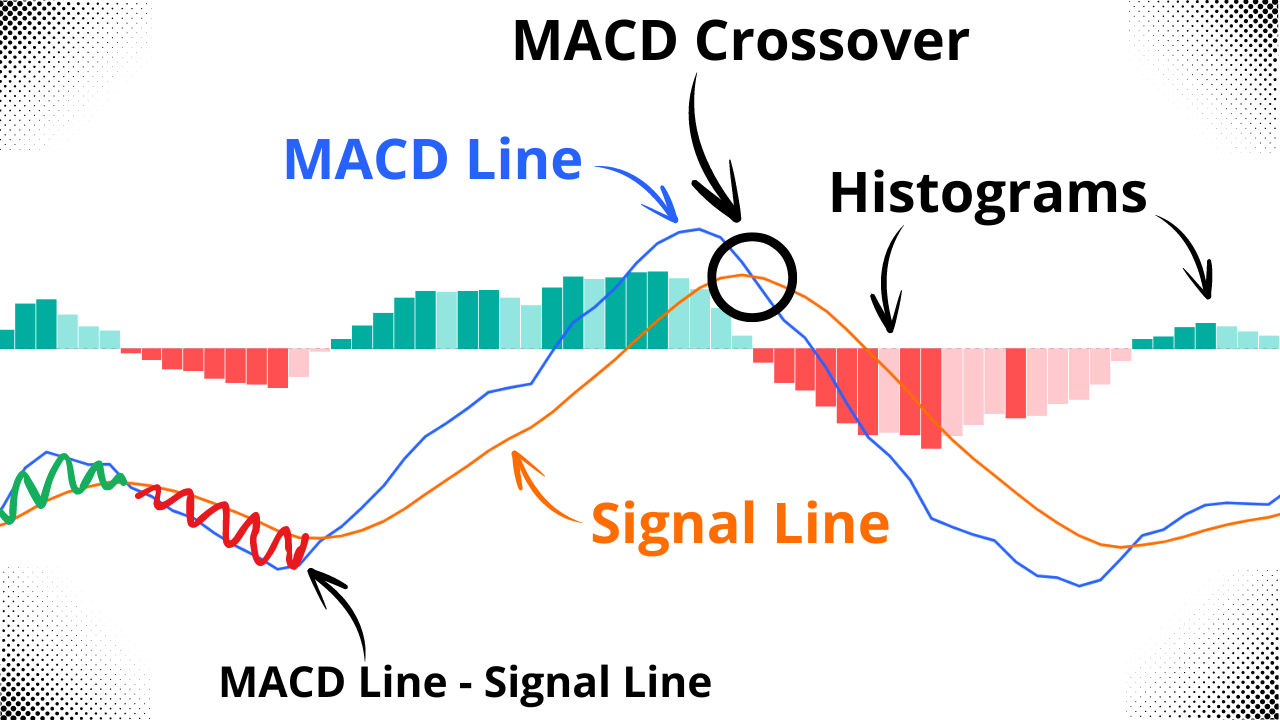
Understanding the MACD Indicator: MACD Line, Signal Line, Histogram, Crossover and Zero Line
What is MACD? If you've been trading for a while, you've likely come across the MACD indicator. While it might seem complex at first glance, the MACD is actually straightforward and highly effective. In this article, you'll learn how the MACD indicator works, and its key components: the MACD line, signal line, histogram, and zero line.

What is a Stablecoin? Understanding Tether (USDT), USDC, and DAI
What is a stablecoin? If you're interested in crypto trading, this is an important question. In this short guide, you'll learn what stablecoins are, their different types, and why they play a vital role in the crypto market.
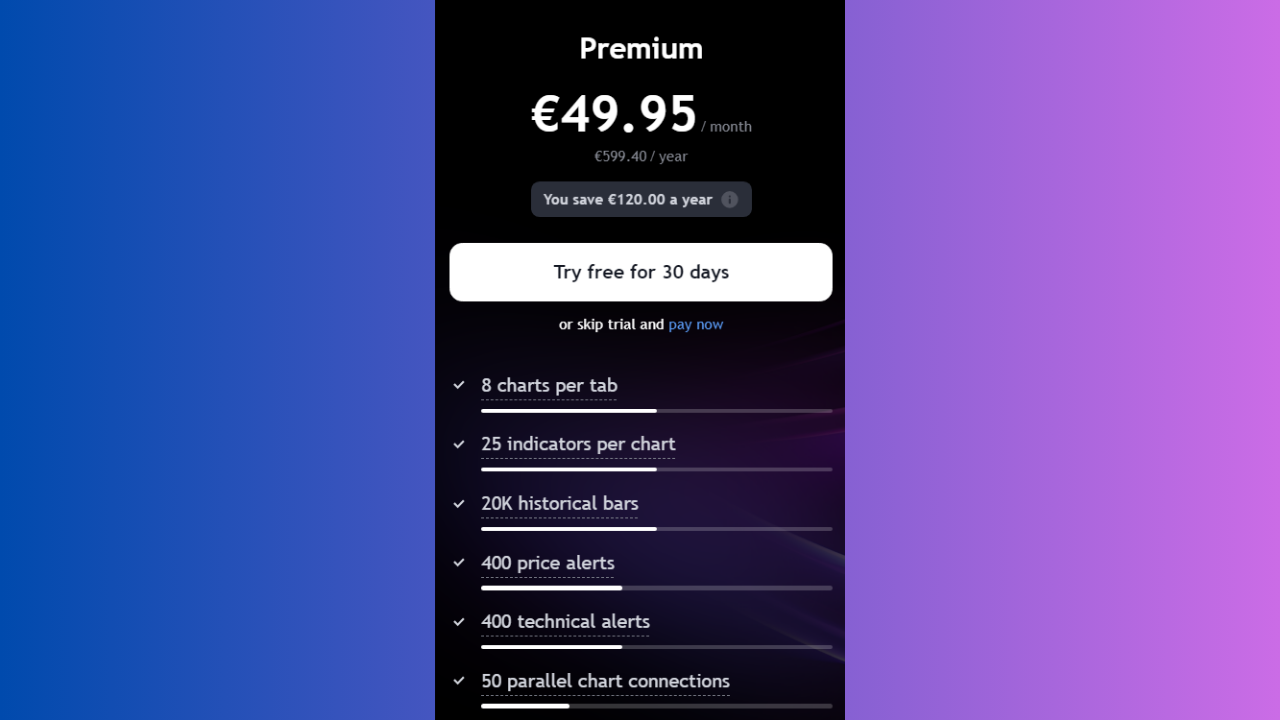
TradingView Plans Comparison: Free vs Essential vs Plus vs Premium
Which TradingView plan is best for you? With over 60 million users worldwide, TradingView is a top platform for charting, trading, and market analysis. In this article, we'll compare the Basic, Essential, Plus, and Premium plans to help you find the right fit.

What is Price Action Trading?
What is Price Action Trading? It's a common, but unfortunately often misunderstood question. Many new traders confuse price action with market structure, and as a result, make trading harder for them. In this blog post, you will learn what price action trading is and how it's different from market structure.

The Doji Candlestick Pattern: Dragonfly, Gravestone, Long-Legged, and Four Price Doji
Every trader should understand Doji Candlesticks. Why? Because Doji Candlestick Patterns, or simply Doji Candles, frequently appear in all markets—whether forex, crypto, or stocks—and provide crucial insights into potential price movements. In this blog post, you’ll discover the most important types of Doji Candles and how to trade them effectively.

Liquidity Grab in Trading: Meaning, Trading Strategy, and Pattern
The Liquidity Grab is a smart money concept every trader should learn! In today’s blog post, you will discover all you need to know about liquidity grabs including liquidity zones and trading strategies that work whether you are trading forex, stocks, or crypto. What are you waiting for? Let’s learn how to identify and trade liquidity grabs right away!

The Arnaud Legoux Moving Average (ALMA): Moving Average Trading
Master the ALMA (Arnaud Legoux Moving Average) indicator to elevate your trading strategy with a blend of smoothness and responsiveness. In this comprehensive guide, we delve into the unique features of ALMA, comparing it with other popular moving averages like SMA, EMA, and HMA. Learn how to set up and optimize ALMA for various market conditions, from volatile cryptocurrencies to stable blue-chip stocks.

Master Market Structure Trading: Shifts, Breaks, BoS, CHoCH, and Trends
Market structure trading might sound confusing when you first hear about it. You may have questions like: How do you identify trends in the market? What is a break of structure? What is Smart Money? In this blog post, I will simplify market structure trading and explain it in a straightforward, step-by-step manner.
